
How to find slope of exponential function
 By
SpreadCheaters
By
SpreadCheaters
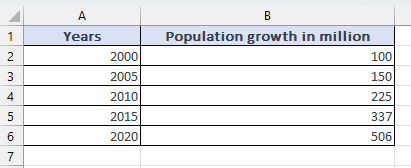
In this tutorial, we will explore the process of finding the slope of an exponential function using a dataset that represents yearly population growth in million. Follow the steps outlined here to gain a thorough understanding of determining the slope of exponential functions.
Finding the slope of an exponential function involves determining the rate of change at any given point on the curve. It helps us understand how quickly or slowly the function is growing or decaying. The slope can be calculated by taking the derivative of the exponential function. Knowing the slope is valuable in various applications, such as modeling population growth, analyzing financial investments, predicting decay rates in radioactive substances, and understanding the behavior of complex systems that exhibit exponential growth or decay.
Step 1 – Select the cell
– Choose the cells containing the data for which you need to find the slope.
Step 2 – Plot the graph

– Select the Insert tab from the menu bar.
– Select the Scatter chart from the chart option in the ribbon.
– Plot the scatter chart with smooth lines and markers.
Step 3 – Display the trendline
– Right-click on any point on the chart.
– A drop-down menu will appear.
– Select Add Trendline option.
– A trendline will appear on the chart.
Step 4 – Display the equation on the chart
– When you add a trendline a task pane will open on the right side of the worksheet.
– From the trendline options select exponential
– Scroll down and tick the Display Equation on the chart option.
– An equation will appear on the chart.
– In the exponential relationship y = ae^(bx), our equation is y = 4E-69e^(0.081x). By comparing the two equations, we can determine that the exponential relationship exhibits exponential growth with a slope of approximately 0.081.


