
How to turn PivotTable into Table
 By
SpreadCheaters
By
SpreadCheaters
PivotTables are great for summarizing and analyzing data, but they are not as flexible when it comes to performing additional calculations or manipulating the data. By converting the pivot table into a regular table, you can easily apply formulas, filters, and other data manipulation techniques to analyze further or modify the data.
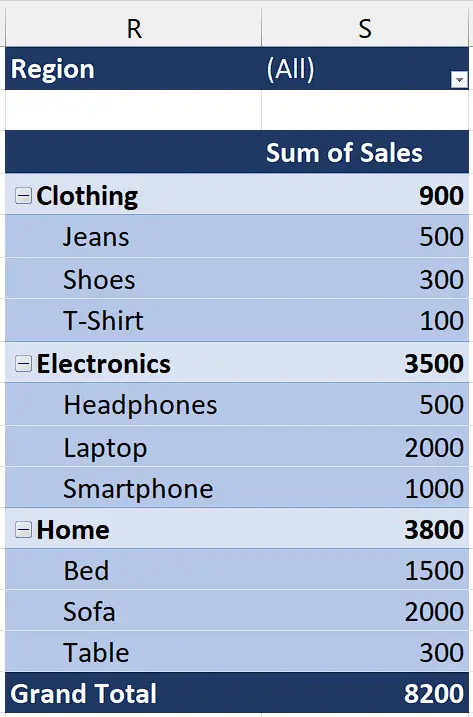
The provided PivotTable shows sales figures for the “Clothing”, “Electronics”, and “Home” categories, along with their respective subcategories. The sales values include “Clothing” items such as Jeans, Shoes, and T-Shirt, “Electronics” items like Headphones, Laptops, and Smartphones, and “Home” items including Bed, Sofa, and Table. The dataset also provides the total sales for each category and the overall total sales of $8200. We will use this PivotTable to learn how to convert a PivotTable into a table.
Method 1 – By Converting Manually
Step 1 – Select and Copy the PivotTable
- Manually select the entire PivotTable that you want to convert into a simple table.
- Then, press “Ctrl+C” to copy it.
Step 2 – Paste the PivotTable
- Now select any empty cell where you paste the PivotTable.
- Then, use the “Ctrl+Alt+V” and a dialogue box will appear on your screen.
- Now, press the “V” key on your keyboard to select the “Values” option.
- After doing all this, press Enter and the PivotTable will be pasted as Range.
Step 3 – Convert Range to Table
- Select the whole range containing data from PivotTable that we just pasted as values.
- Now, use the “Ctrl+T” key to convert it into a Table.
Method 2 – By using the VBA code
Step 1 – Insert a module
- For adding a module, navigate to the Developer tab.
- After that, click on the first option named Visual Basic.
- You’ll see a new window on your screen and you can also open this window by using the shortcut key (Alt+F11) as well.
- Then, click on the Insert tab in this window and click on the Module option.
- Now, a new module would open.
Step 2 – Write the code
- We will write the following code in the Module. (You can modify this code for your PivotTable).
Sub Convert_to_Table()
Selection.Copy
Range(“L1”).Select
Selection.PasteSpecial Paste:=xlPasteValues, Operation:=xlNone, SkipBlanks _
:=False, Transpose:=False
Application.CutCopyMode = False
Application.CutCopyMode = False
ActiveSheet.ListObjects.Add(xlSrcRange, Range(“$L$1:$M$16”), , xlYes).Name = _
“Table3”
Range(“Table3[#All]”).Select
End Sub
- After writing the code, just close the VBA Editor.
Step 3 – Select the PivotTable

- Manually select the entire PivotTable that you want to convert into a simple table.
Step 4 – Convert PivotTable to Table
- Use the “Alt+F8” shortcut key to open the “Run a macro” dialogue box.
- Then, select the macro named “Convert_to_Table” and then click on “Run”.
- The macro will run and a new table will be created.
Explanation of VBA code used in Method 2:
The given VBA code is a macro named “Convert_to_Table” that automates the conversion of a selected range into a table in Microsoft Excel. The code begins by copying the selected range and then pasting its values into cell L1. The subsequent lines ensure that the clipboard is cleared. Afterward, a new list object (table) is added to the active sheet, using the range from L1 to M16. The created table is named “Table3”. Finally, the entire table is selected for further manipulation or analysis. This code can be used by individuals who want to quickly convert a selected range into a table in Excel. By modifying the range parameters, users can adapt the code to their specific data and requirements.


