
How to switch Axis in Google Sheets
 By
SpreadCheaters
By
SpreadCheaters
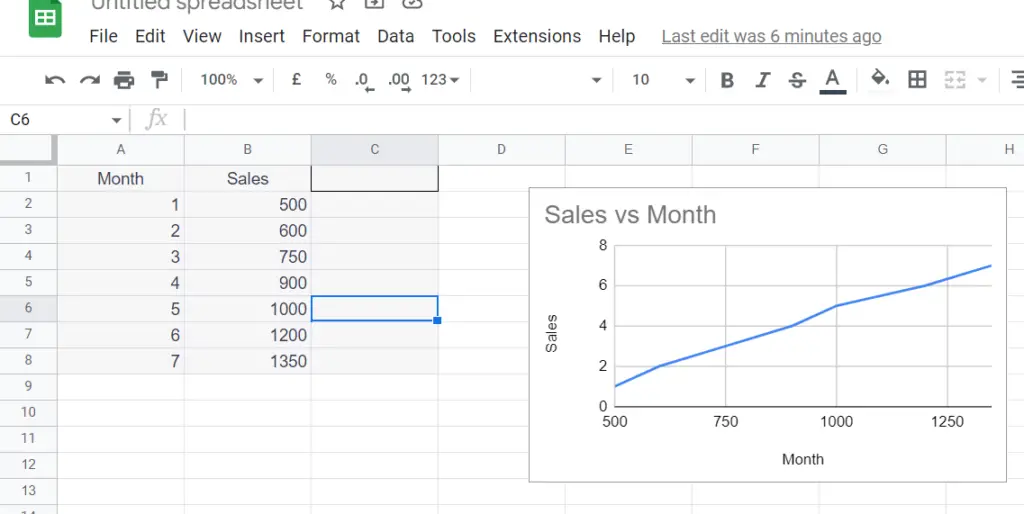
In this tutorial, we will learn how to switch axes in google sheets. The following data above shows the number of months and the sales during those months. We will use the following dataset to learn how to switch axes in google sheets.
In Google Sheets, “axis” refers to the horizontal and vertical lines forming a spreadsheet grid. The horizontal axis is also called the X-axis, and the vertical axis is called the Y-axis. Understanding the axes is essential for navigating and manipulating data in a Google Sheets spreadsheet. It is also necessary when using formulas or functions that reference cells based on their location within the grid. The axes can only be switched when the data is plotted in the form of digits.
Step 1 – Click on the chart to enable options
– Click on the chart to enable options.
– Three dots (ellipsis) will appear.
Step 2 – Click on the edit chart option
– When you click on the three dots, a dropdown menu will appear.
– Select the first option, i.e; Edit the chart
Step 3 – Switch the axes.

– When you click on the Edit chart option, a sidebar will appear.
– Now click on the x-axis option and change the category, similarly click on the series and change the category.


