
How to show slope on Google Sheets
 By
SpreadCheaters
By
SpreadCheaters
Slope is a graphical representation of data. Slope is used to represent change of a quantity with respect to other quantity , mostly time. The slope explains the relationship between the independent and dependent variables.Sometimes databases where dependent and independent quantities exist become very large and it becomes difficult to understand the trend of changing data.Here slopes help a lot by showing data graphically which makes it easy for viewers to notice trends of changing data.
In this tutorial we will learn how to show slope on google sheet.To form slope there are 2 methods explained below. In First method we form a chart of our data and then form a trend line to get the equation of the line,from this equation we get the slope.In Second method we find the slope of our data using the formula of SLOPE.
Method 1: Slope through Charts
Step 1 – Select the Data
- Select the data for which slope is required
Step 2 – Click on Insert Tab
- Click on Insert Tab in task bar and a dropdown menu will appear
Step 3 – click on chart
- From the dropdown menu click on Chart and the slope will appear on the sheet
Step 4 – Select line chart
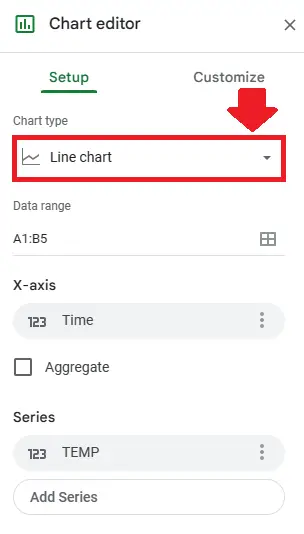
- When the slope will appear on the sheet along with it a dialog box will appear
- From this dialog box select the Line graph from Chart Type option
Step 5- Select data for X axis and Y axis of slope
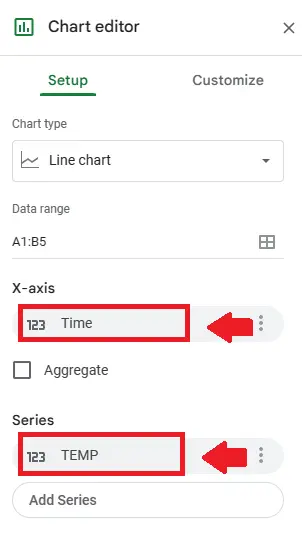
- From the dialog box select the data to be shown on x axis in the box below the X – axis option
- Select the data to be shown on y axis in the box below the Y – axis option
Step 6 – Click on the graph
- Click on the graph and a dialog box will appear
Step 7 – Click on Series
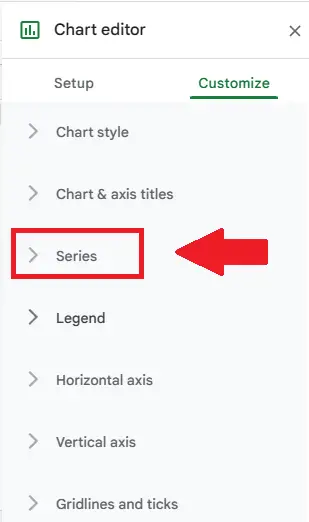
- Click on series in the dropdown menu below customize option
Step 8 – click on Trend Line
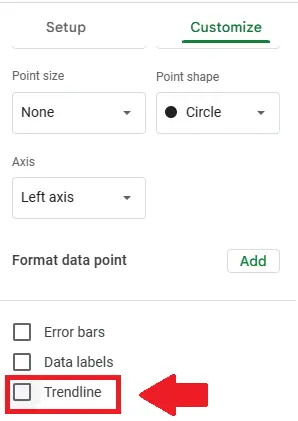
- An extended menu will appear after clicking on Series
- From this menu click on trend Line
Step 9 – Click on Use Equation
- An extended menu will appear after clicking on Trendline
- From this menu select Use equation in the box below the Label option and Equation of slope will appear at top of the chart
- First term of this equation(m) is the slope of the data (y=m*x+c), in our case its value is 1.
Method 2: Slope of data through formula
The slope function can be used to calculate the slope from the data without even plotting the graphs. The syntax of the SLOPE function is as follows;
SLOPE(data_y, data_x)
where;
data_y – The range representing the array or matrix of dependent data.
data_x – The range representing the array or matrix of independent data.
So, follow the steps mentioned below to learn how to use this function in Google Sheets.
Step 1 – Select the cell
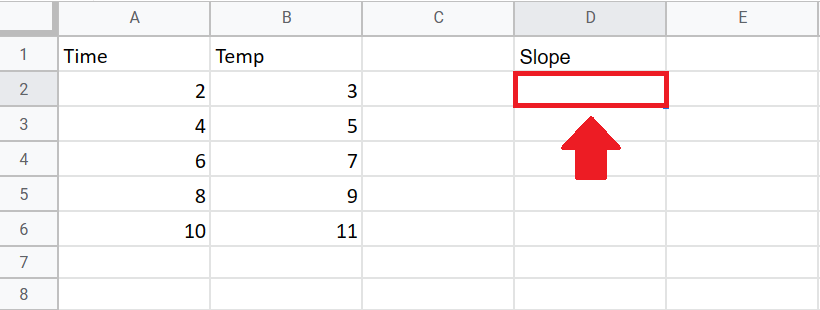
- Select the cell where you want to show the slope of data.
Step 2 – Use Slope Function
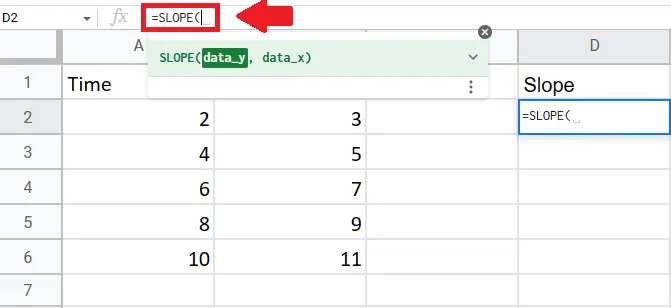
- Use slope function by typing “=SLOPE(” in formula tab
Step 3 – Select range of data at x and y axis
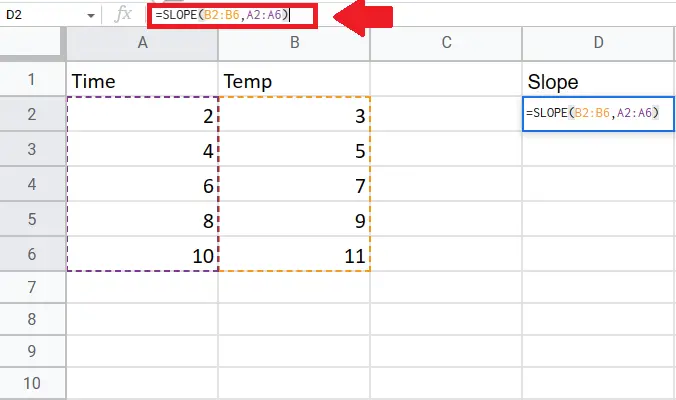
- Type range of data at Y axis
- Type a comma (,) after typing range of Y axis
- Typing comma than type the range of data at X axis
- Type closing bracket “)” after typing range of x axis
Step 4 – Press Enter key
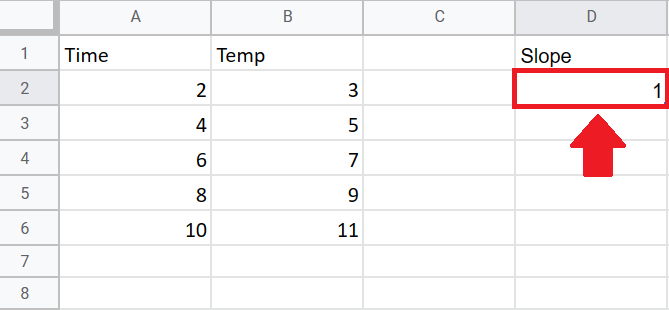
- Press Enter key to get the slope in selected cell


