
How to run a script in Google Sheets
 By
SpreadCheaters
By
SpreadCheaters
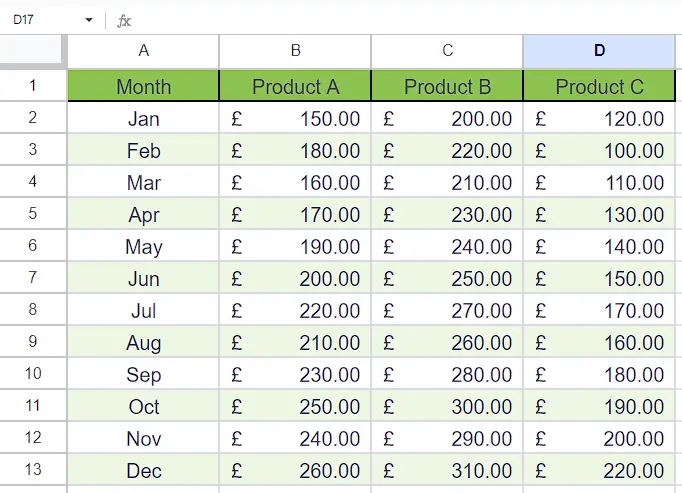
In this tutorial, we will explore how to create a line chart using app script code for a dataset that includes sales data for three products: Product A, Product B, and Product C. By following the steps outlined, we will gain an understanding of how to generate a line chart efficiently. This knowledge will be invaluable for visualizing sales trends and patterns.
Apps Script is a scripting platform developed by Google that allows users to automate and extend the functionality of various Google services, including Google Sheets. Apps Script follows its scripting language called Google Apps Script. It is a server-side JavaScript-based language that is specifically designed for automating and extending Google Workspace applications such as Google Sheets, Google Docs, Google Slides, and others.
Step 1 – Open the App Script
– Navigate to the “Extension” tab in the ribbon.
– Then, click on the “App Script” option.
– This will open a new tab in your browser.
Step 2 – Rename the Project
– Now, click on the “Untitled Project” and it will open a dialogue box named “Rename Project”.
– Change the name of the Project according to your preference.
– Then, click on the “Rename Project” option to rename the project.
Step 3 – Write the code
– Write your code in the code area.
– For example, we are writing the following code here
1. function createLineChart() {
2. // Get the active sheet
3. var sheet = SpreadsheetApp.getActiveSpreadsheet().getActiveSheet();
4.
5. // Define the range containing the data
6. var range = sheet.getRange(“A1:D13”);
7.
8. // Create a new chart
9. var chart = sheet.newChart()
10. .asLineChart()
11. .addRange(range)
12. .setPosition(1, 6, 0, 0) // Reposition the chart to start at cell F1
13. .setOption(‘title’, ‘Product Sales’)
14. .setOption(‘vAxis’, { title: ‘Sales’ })
15. .setOption(‘hAxis’, { title: ‘Month’ })
16. .setOption(‘legend’, { position: ‘top’ })
17. .build();
18.
19. // Insert the chart into the sheet
20. sheet.insertChart(chart);
21.
22. }
23.
– After that, click on the “Save Project” Button.
Step 4 – Run the script
– After saving the code, click on the “Run” button to run the script.
– You will be prompted to grant the necessary permissions, which you can allow to authorize the script to run.
– Upon execution of the script, you will observe that the chart indicates that the script has successfully run.


