
How To Perform Sensitivity Analysis In Excel
 By
SpreadCheaters
By
SpreadCheaters
Sensitivity analysis is a method used to assess the impact of changes in input variables on the output or outcome of a model, system, or decision-making process. It helps in understanding the relationships and dependencies between the input variables and the resulting output, allowing for a better understanding of the system’s behavior and informing decision-making.
The goal of sensitivity analysis is to identify which variables have the most significant influence on the output and to quantify the extent of their impact. By varying the values of individual or multiple input variables and observing the corresponding changes in the output, sensitivity analysis provides insights into the relative importance of different factors and how they contribute to the overall outcome.
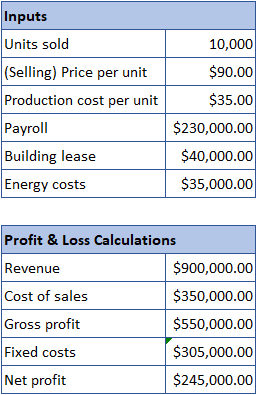
We have the following dataset for our article.
Method 1 – One Variable Sensitivity Analysis
In one variable sensitivity analysis, only one input variable is varied at a time while keeping all other variables constant. The purpose is to assess the impact of changes in that particular variable on the output. The analysis involves systematically varying the value of the single input variable and observing the resulting changes in the output. This approach helps in understanding the relationship between that specific variable and the model’s response, such as how changes in the variable affect the output. In our example, we’ll calcualte the effect of variable Selling Price on Net Profit.
Step 1 – Paste Value Of Net Profit
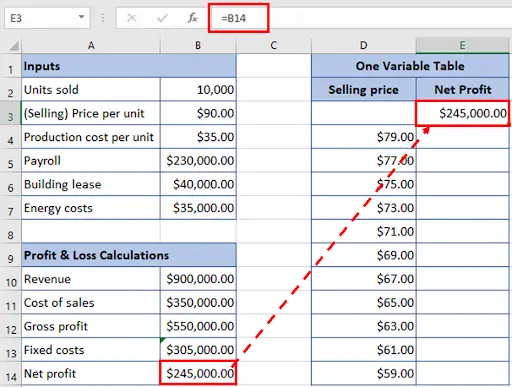
- Paste the value of net profit by referencing the cell in the sensitivity analysis table. We will be referencing the cell B14 in cell E3 for our example.
Step 2 – Select The Table
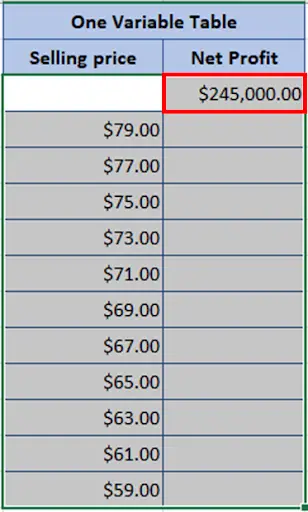
- Select the one variable table by dragging the mouse.
Step 3 – Go To The Data Tab
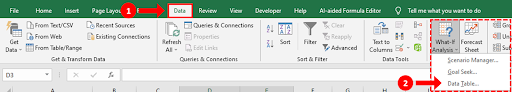
- Go to the Data tab, under the Forecast group click the What-if Analysis button.
- Select Data Table from the drop down menu.
Step 4 – Data Table Dialog Box
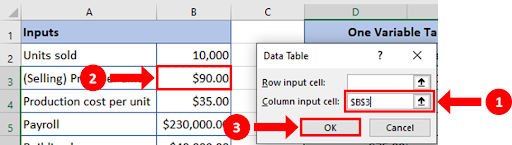
- When you click on the Data Table, the Data Table dialog box will appear on your screen.
- Since we are calculating the sensitivity analysis on Selling price per unit, we will place courser in Column input cell & select cell B3.
- Click the OK button.
Step 5 – Analysis Calculated
- One variable sensitivity analysis calculated.
Method 2 – Two Variable Sensitivity Analysis
In two variable sensitivity analysis, the interaction between two input variables is considered simultaneously. Instead of varying just one variable, both variables are simultaneously changed to observe the combined effect on the output. This analysis helps in understanding not only the individual impact of each variable but also the interaction and synergy between them. It provides insights into how changes in two variables together influence the output and whether there are any nonlinear relationships or interactions between them. In our example, we’ll see the effect of varying Selling Price and number of Units Sold.
Step 1 – Paste Value Of Net Profit
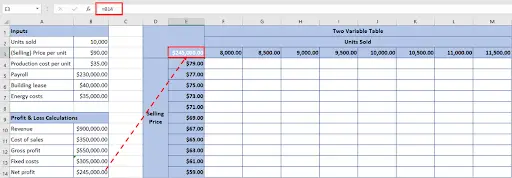
- Paste the value of net profit by referencing the cell in the sensitivity analysis table. We will be referencing the cell B14 in cell E3 for our example.
Step 2 – Select The Table
- Select the table by dragging the mouse.
Step 3 – Go To The Data Tab

- Go to the Data tab, under the Forecast group click the What-if Analysis button.
- Select Data Table from the drop down menu.
Step 4 – Data Table Dialog Box
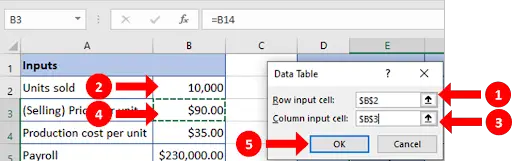
- When you click on the Data Table, the Data Table dialog box will appear on your screen.
- Now, that we are calculating two variable sensitivity analysis i.e Units Sold & Selling price per unit, place the courser in Row input cell & Column input cell & select the cell B2 & B3 one by one.
- Click the OK button.
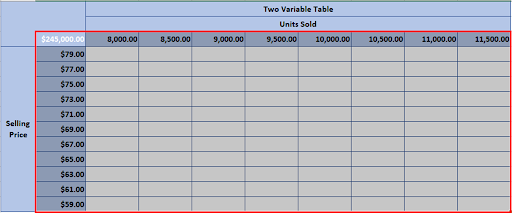
Step 5 – Two Variable Sensitivity Analysis Calculated
- You can easily calculate two variable sensitivity analysis by the above method.


