
How to make a frequency table in Google Sheets
 By
SpreadCheaters
By
SpreadCheaters
Making a frequency table in Google Sheets involves creating a table that displays the frequency or count of each unique value or category in a given dataset. This can be useful for organizing and summarizing large amounts of data. It also helps in Communicating findings, Comparing different datasets, and understanding data distribution.
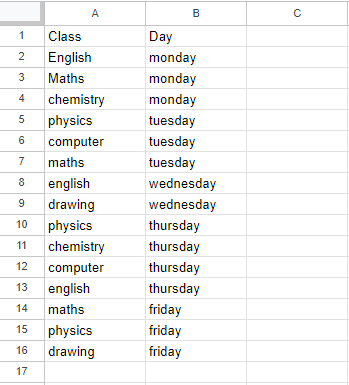
A college has a schedule of classes that are held on different days of the week. We want to determine the number of classes each subject has in a week, so we need to create a frequency table of classes. To create this table, we have two methods, the first is by using the Pivot table and the second method is by using the Frequency function. The following steps will guide you to use the Pivot table.
Method 1: Make a Frequency table by using the Pivot Table
Step 1 – Select the range of Cells
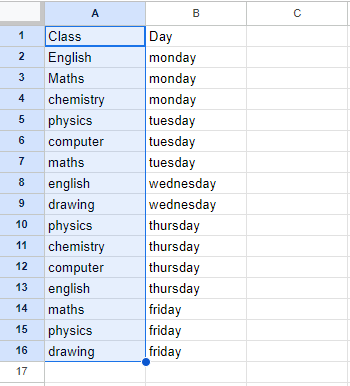
Select the range of cells for which you want to form the frequency table
Step 2 – Click on the Insert tab
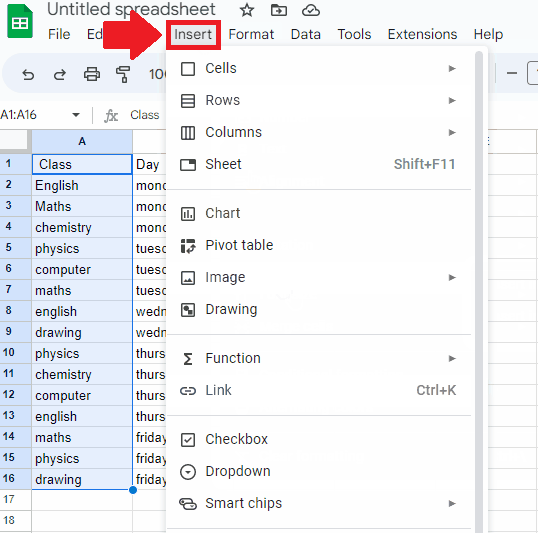
- After selecting the range of cells, click on the Insert tab and a drop-down menu will appear
Step 3 – Click on the Pivot table option
- In the drop-down menu, click on the Pivot table option and a dialog box will appear
Step 4 – Click on Create option
- In the dialog box, click on the Create option at the end of the dialog box and a pivot table will appear in a new sheet
Step 5 – Select the Row
- In the new sheet, a table and a dialog box(on the right side of the sheet) will appear
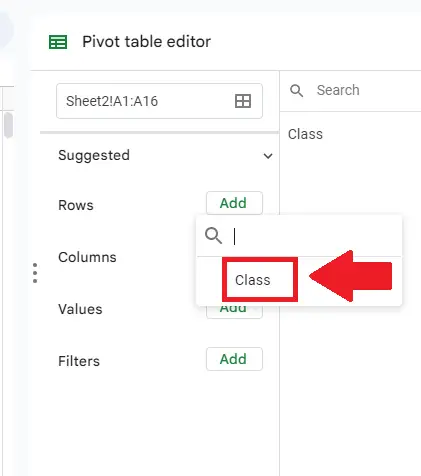
- From this dialog box click on the Rows option and a dropdown menu will appear
- From this menu, select “Subject” by clicking it
Step 6 – Select the Values
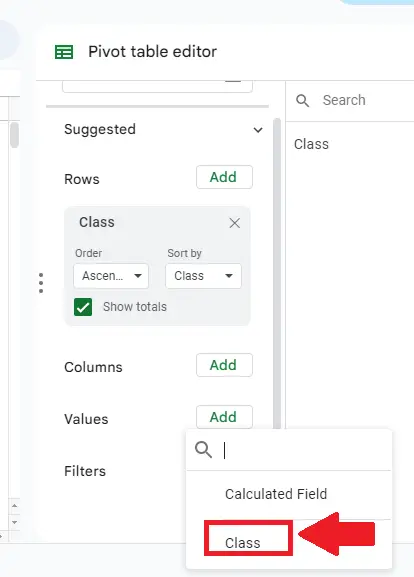
- In the dialog box, click on the Values option and a drop-down menu will appear
- From this menu select “Class” by clicking it
Step 7 – Select the Function
- After selecting the Class in values option an extended dialog box will appear.
- In this dialog box, select the “COUNTA” function in the box below the Summerize by option to get the required result
Method 2: Make frequency using the Frequency function
In Google Sheets, the frequency function calculates how often values occur within a range of cells. The syntax for the frequency function is as follows:
= frequency(data,classes)
- data: This is the range of cells containing the data for which you want to calculate the frequency distribution.
- Classes: This is the range of cells containing the bins (i.e., intervals) that you want to use for the frequency distribution.
Step 1 – Select the cell
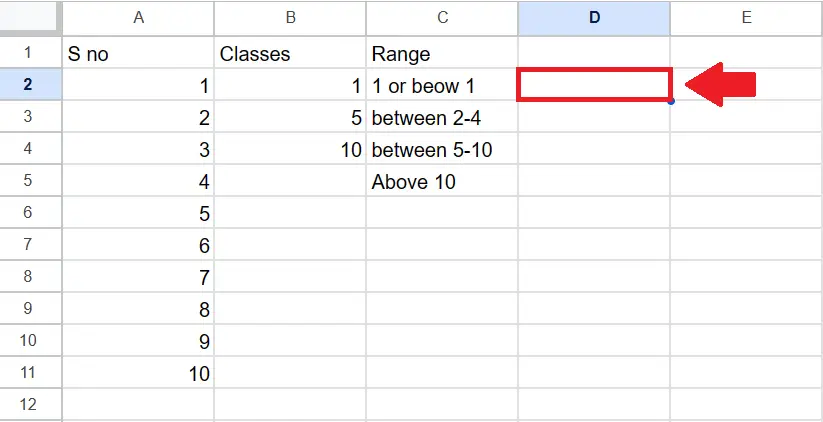
- Click on the cell where you want to show the frequency
Step 2 – Use the FREQUENCY function
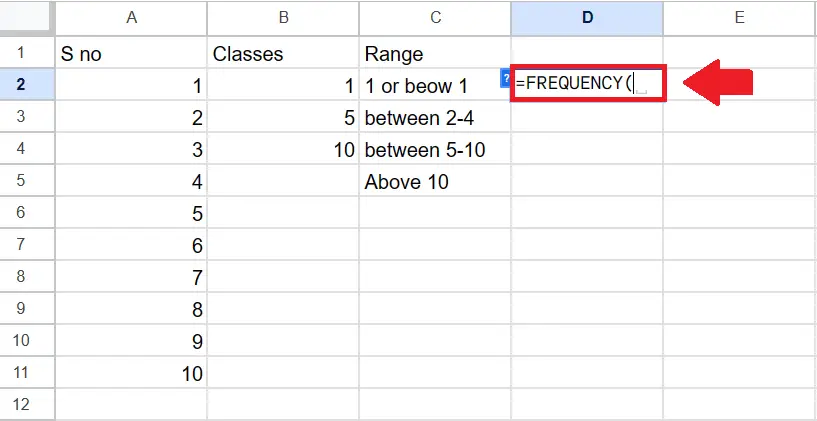
- In the selected cell, type the “=FREQUENCY(” to use the function
Step 3 – Type the Arguments
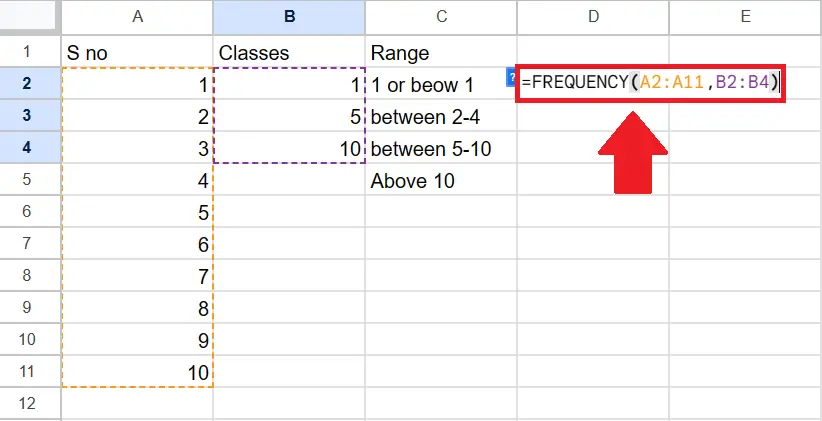
- Type the arguments of the function below:
- Data: A2:A11
- Classes: B2:B4
Step 4 – Press the Enter key
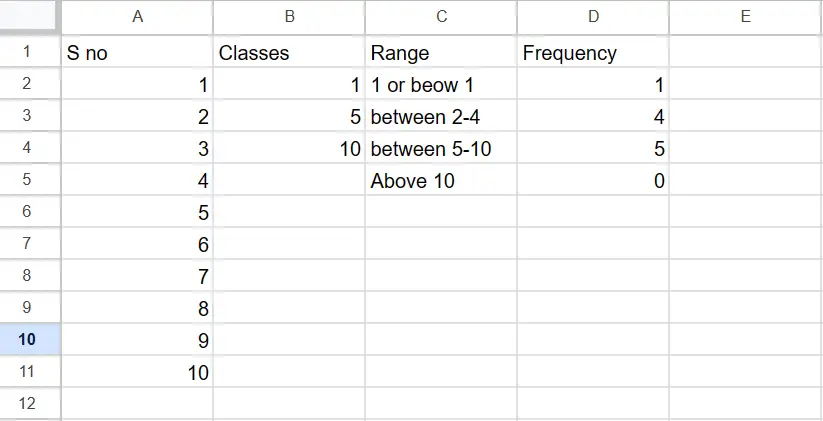
- After typing the arguments, type the ENTER key to get the required result


