
How to flip the x and y axis in Google Sheets
 By
SpreadCheaters
By
SpreadCheaters
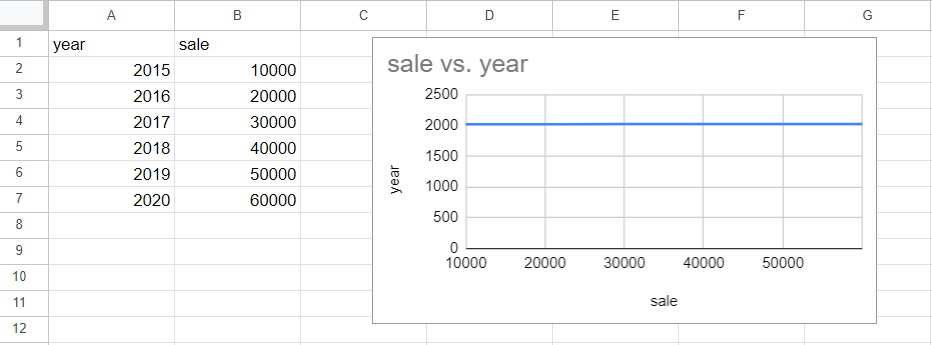
In our data set the average daily sale of a shop is shown in different years in graphical form. To explain it better we want to flip the X-axis and Y-axis of the chart. For this, we will use the Edit chart option. The following steps will guide you to use this option.
Flipping the x and y axis in Google Sheets means swapping the horizontal and vertical axes of a chart. Flipping the axis would make the x-axis the vertical axis and the y-axis the horizontal axis. Flipping the x and y axis can be a useful tool for visualizing and analyzing data in Google Sheets, particularly when trying to identify patterns or relationships in the data.
Step 1 – Click on the 3-dot symbol
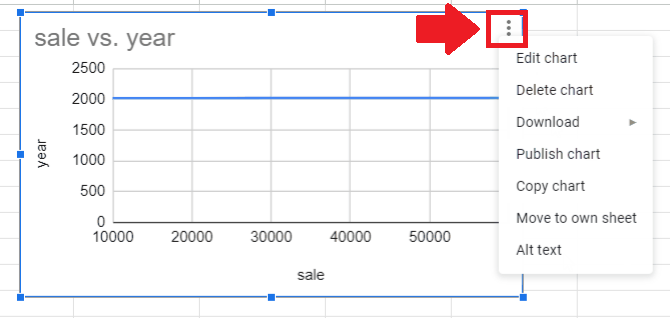
– Click anywhere on the graph and it will get selected
– After it got selected three dots symbol will appear at a top
– Click the three dots symbol and a dropdown menu will appear
Step 2 – Click on the Edit Chart option
– In the dropdown menu, click on the Edit Chart option and a dialog box will appear at the right of the sheet
Step 3 – Change the Axis
– From the dialog box, change the axis
– You can change the axis by clicking on the boxes below the Series and X-axis options
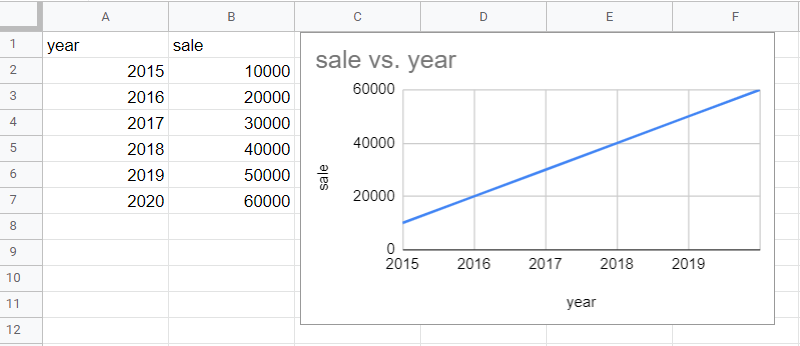
Step 4 – Get the result

– After changing the X and Y axis, the chart will get automatically updated.


