
How to find a point on a graph in Excel
 By
SpreadCheaters
By
SpreadCheaters
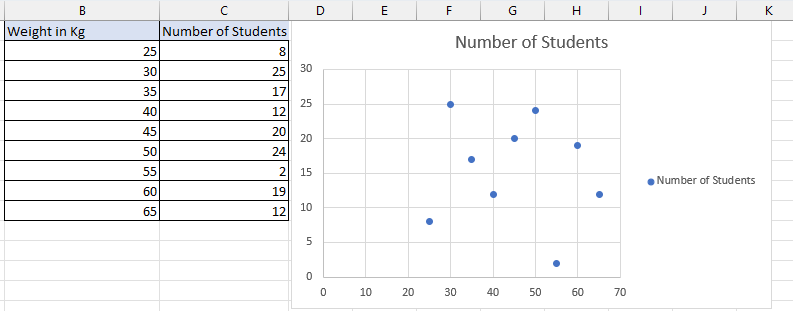
In this tutorial, we have a dataset consisting of student weights in kilograms and the corresponding number of students at each weight. We have plotted a graph to represent this data. We will use this dataset and chart to demonstrate how to display a specific point on a graph in Excel.
Finding a point on a graph in Excel involves determining the coordinates of a specific plotted point. This process is valuable for data analysis, interpolation or extrapolation, accurate reporting, and data verification. It enables a deeper understanding of relationships between variables, estimation of values between or beyond data points, precise communication of findings, and validation of graph accuracy. Excel provides a practical tool for extracting specific data from visual representations.
Step 1 – Add data labels
– Select any point on the graph
– Right click on the point
– A dropdown menu will appear
– Select Add Data Labels
Step 2 – Open the “Format Data Labels” task pane
– By adding data labels it will by default show the Y coordinate values.
– In order to remove that Right click on any point on the graph.
– Select Format Data Labels.
– A task pane will open on the right side of the worksheet.
Step 3 – Select “value from cells”
– In the task pane, locate and tick the Value from Cells option.
– A small Data Label Range window will open
– Select the range from the row number column
– Select OK
Step 4 – Remove Y coordinates
– Now we can see the row number and the Y coordinates together on the graph.
– In order to remove Y coordinates uncheck the Y value option from the Format Data Labels task pane.
– After removing Y values the only thing remains on the chart are row numbers.
– Row numbers remain as a helpful reference for finding specific points in a graph.


