
How to do T-TEST in Google Sheets
 By
SpreadCheaters
By
SpreadCheaters
The T-TEST is a statistical analysis used to determine whether the means of two groups are significantly different from each other. This test is commonly used in scientific research and data analysis to compare the effectiveness of different treatments, interventions, or programs. One popular tool for performing a T-Test is Google Sheets,
Statisticians usually use the T TEST function in Google Sheets to check if two data sets are equal or closely related for several reasons, in medical research, for instance, experiments, etc. Otherwise, you can use the T TEST function while comparing the averages of two data sets as well.
In this article, we will walk you through the steps of performing a T-Test in Google Sheets, using a simple example data set.
Syntax:
The procedure of T TEST is functional by formula, there is built-in formula present to find T TEST in Google sheets.
=T.Test(range1, range2, tails, type)
- Range 1: This is the first data range of the samples which will be considered for examination.
- Range 2: This is the second data range of the samples which will be considered for examination.
- Tails: In this argument of the syntax there are two parameters either “1” or “2” to describe the distribution of parameters.
- Type: At last, we will give the domain of T TEST type that which type of T TEST you are applying.
The type of T TEST in syntax is also defined by the numbers “1”, “2” and “3”.
- “1” indicates the paired samples T TEST.
- “2” indicates the two samples T TEST (Equal variance).
- “3” indicates the two samples T TEST (Unequal variance).
Paired Sample T TEST: If you have different two sets of data from different origins compare whether there are differences or probably not and find the value of T TEST. This type of T TEST is known as Two sample T TEST.
Two Sample T TEST (Equal Variance): When the quantities of values or numbers are equal in both samples and data set is called Equal variance between two samples T TEST.
Two Sample T TEST (Unequal Variance): When the quantities of values or numbers are unequal in both samples and data set is called Unequal variance between two samples T TEST.
Now let’s get started with our example.
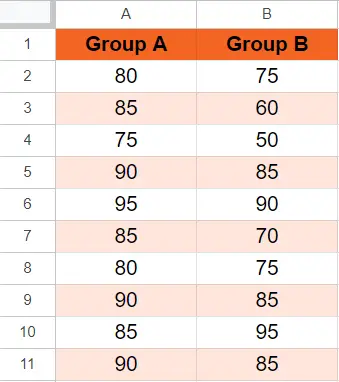
Suppose we want to compare the test scores of two groups of students, Group A and Group B, on a Maths test. Each group consists of 10 randomly selected students. Here are the test scores:
Paired Sample T TEST
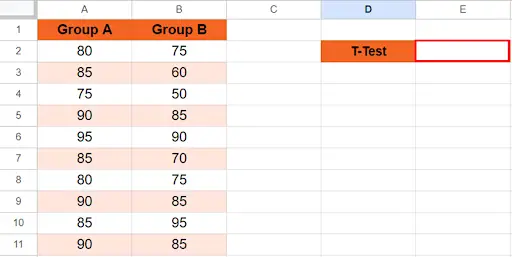
Step 1 – Select Cell

- Place your cursor in a cell where you want to find the value of T TEST.
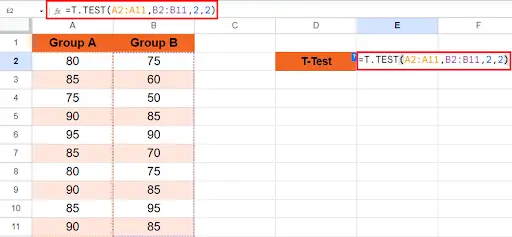
Step 2 – Type The Formula

- Type the formula starting with equals to (=) sign.
Step 3 – Get The Paired Sample T Test Result
- When you finish typing the formula, press enter.
- You will get a T TEST value.
Two Sample T TEST (Equal Variance)
Step 1 – Select Cell
- Place your cursor in a cell where you want to find the value of T TEST.
Step 2 – Type The Formula
- Type the formula starting with equals to (=) sign.
Step 3 – Get The Two Sample T TEST (Equal Variance) Result
- When you finish typing the formula, press enter.
- You will get a T TEST value.
Two Sample T TEST (Unequal Variance)
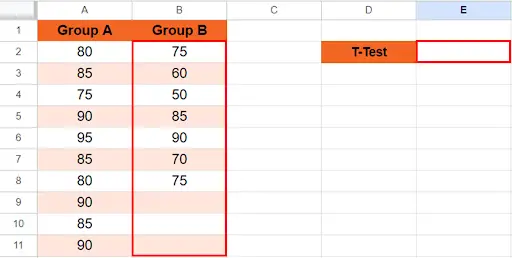
For this type of T TEST we change our dataset a little bit. We will delete marks of 3 students to properly execute the formula.
Step 1 – Select Cell
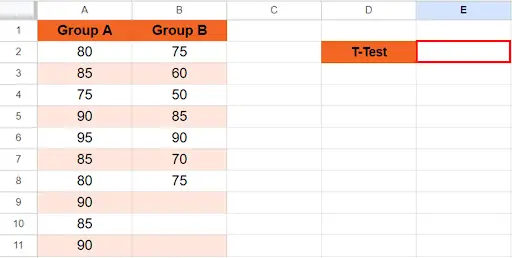
- Place your cursor in a cell where you want to find the value of T TEST.
Step 2 – Type The Formula
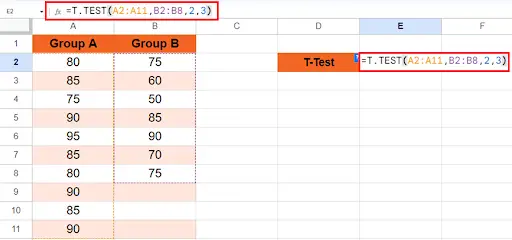
- Type the formula starting with equals to (=) sign.
Step 3 – Get The Two Sample T TEST (Unequal Variance) Result
- When you finish typing the formula, press enter.
- You will get a T TEST value.


