
How to copy and paste the charts from Google Sheets.
 By
SpreadCheaters
By
SpreadCheaters
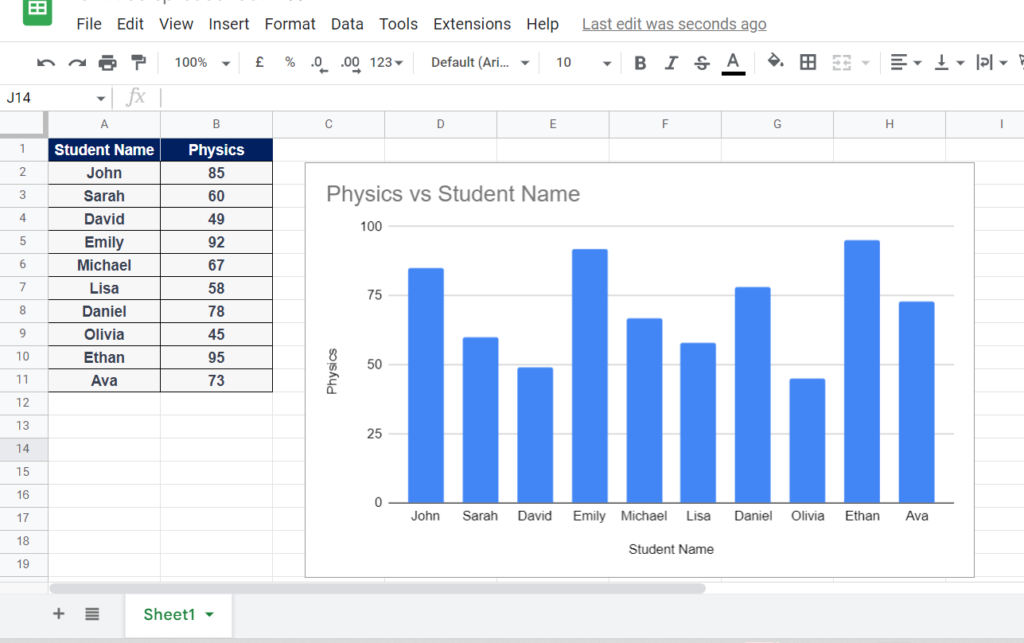
In this tutorial we will learn how to copy and paste the chart in google sheets. The following data above shows the marks that are obtained by the students in the subject physics. The chart is already plotted, now we’ll learn how to copy and paste it, so follow the given steps.

A chart is a graphical representation of data or information, typically used to visualize and communicate relationships or patterns within the data. Charts can take many forms, including bar charts, line charts, scatter plots, pie charts, and more. Charts are often used to make complex data more understandable by presenting it in a visual format. Charts can be used to show trends over time, compare different data sets, or highlight key data points.
Step 1 – Click on the chart to enable options.
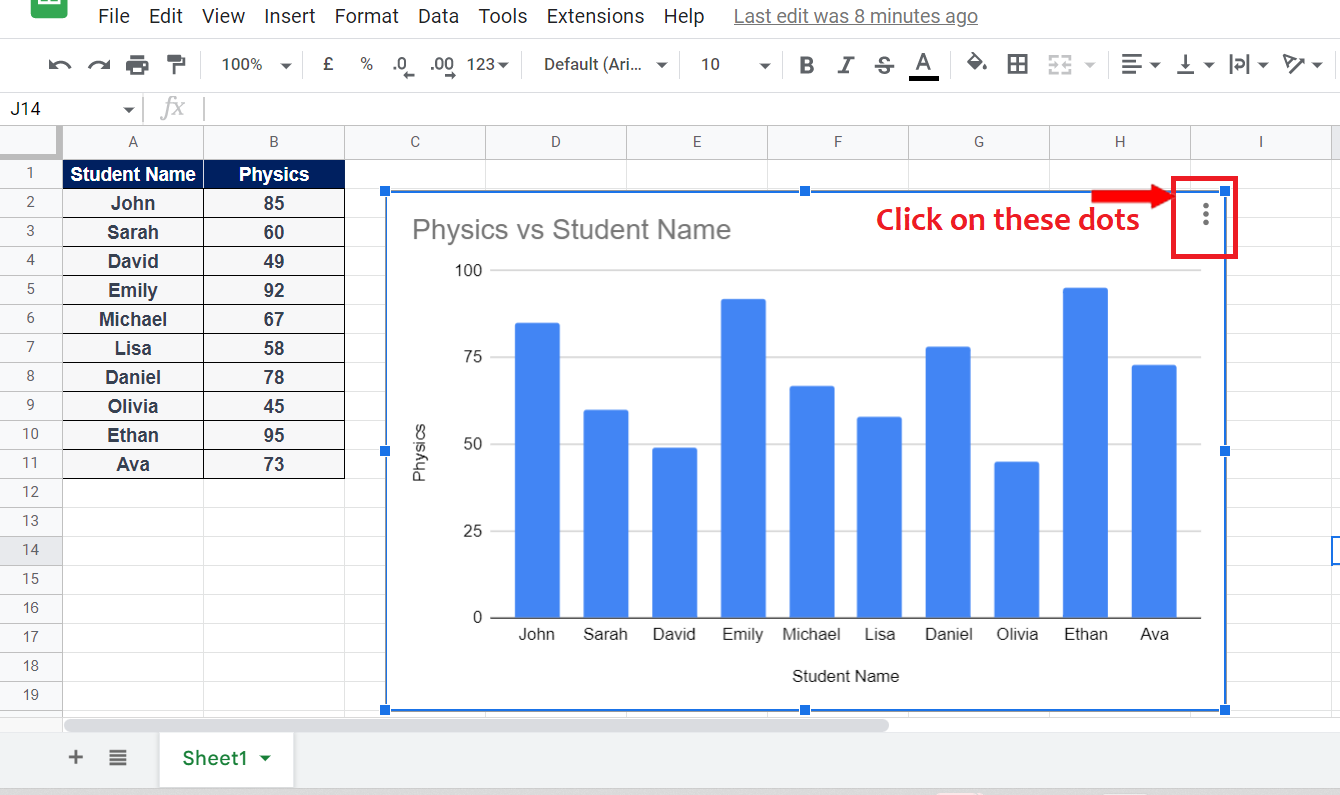
– Click on the chart to enable the options.
– Three dots on the top right corner will appear , click them.
Step 2 – Copy the chart.
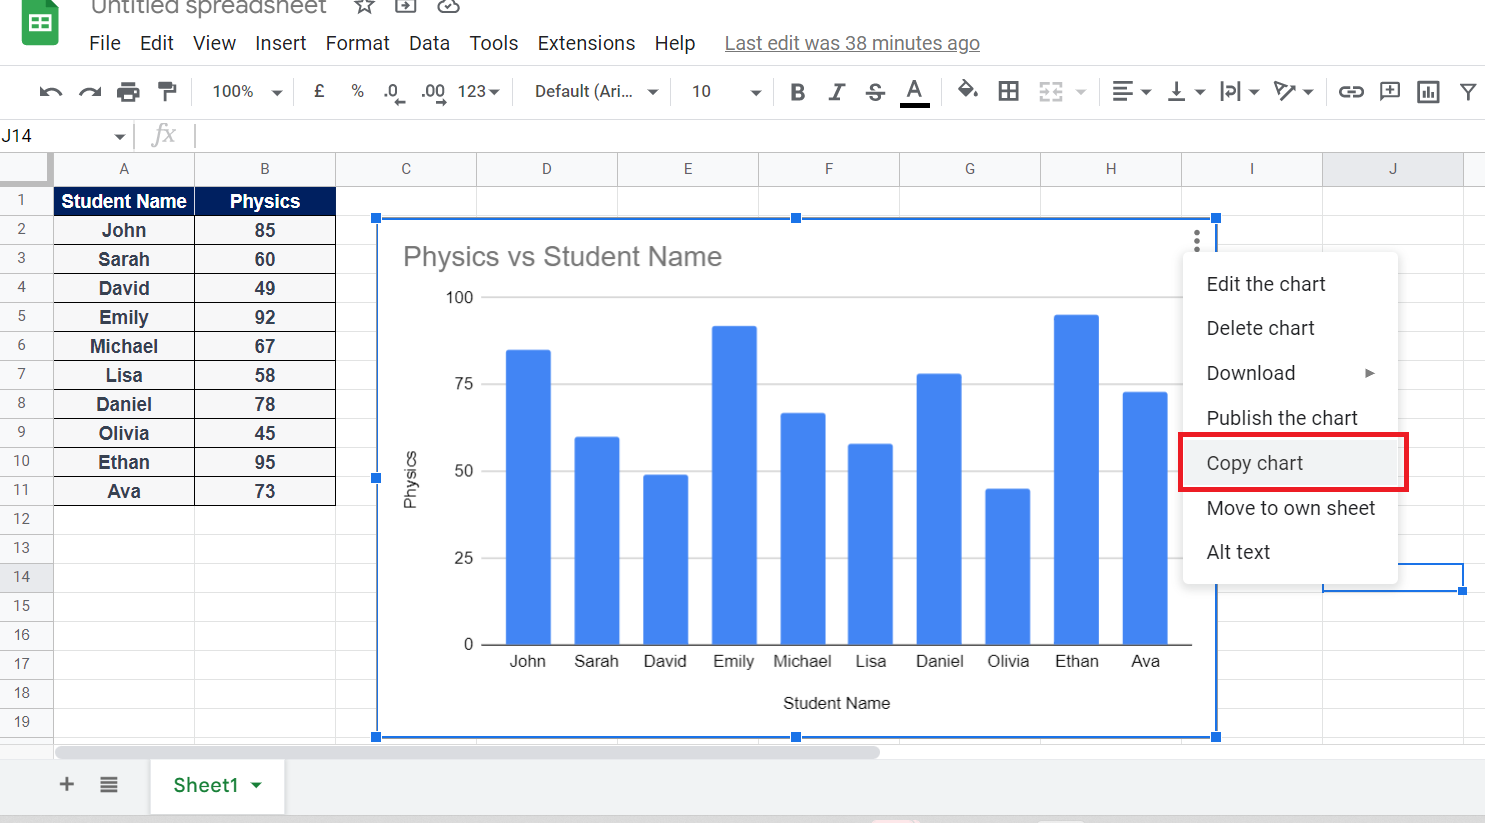
– Select the copy option from the menu.
Step 3 – Add a new sheet.
– Add a new sheet, so we can paste the chart in that sheet.
– Press on the “+” action button available in the bottom left corner of the Sheets to add a new sheet as shown above.
Step 4 – Paste the chart.
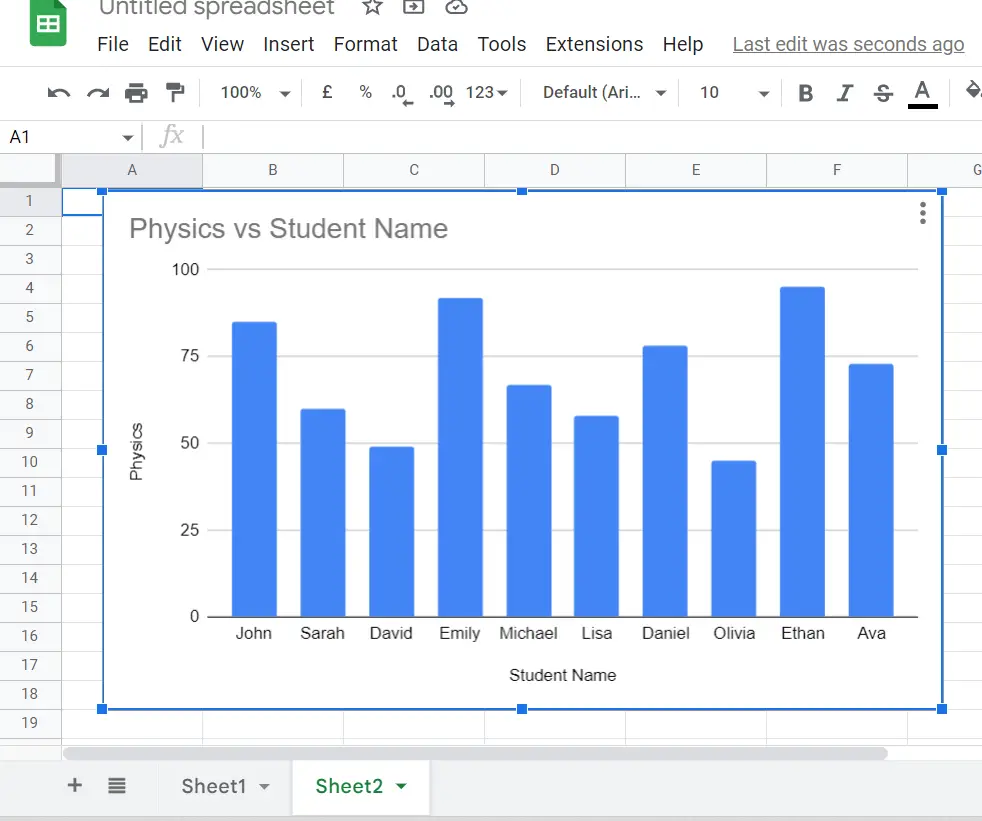
– Now paste the chart by using the shortcut key Ctrl + V or from the context menu.
– Paste the chart in the sheet we have recently added.


