
How to calculate variance in Google Sheets
 By
SpreadCheaters
By
SpreadCheaters
Variance in Google Sheets shows the amount of variation or dispersion present in a dataset and the degree to which each value in the dataset differs from its mean or average value. Computing the variance allows us to obtain a better understanding of the data distribution, which can be advantageous in various fields such as finance, science, and engineering.
In this tutorial, we will learn how to calculate variance in Google Sheets. It is possible for calculating the variance in Google Sheets by the built-in VAR function. Also, another function VARP is used in Google Sheets to calculate the Variance of the entire population which calculates the amount of variation or dispersion within a population of data.
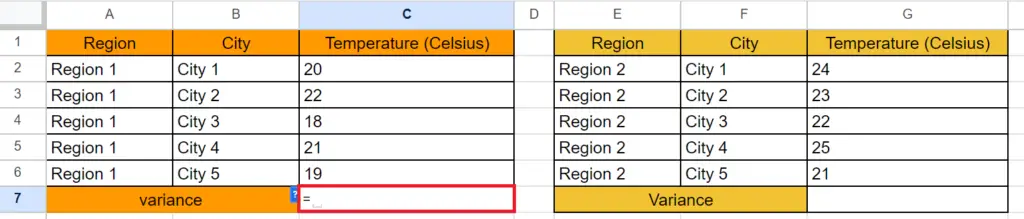
We have a data set representing the temperature of some cities in two different regions. Our aim is to check the variance in the temperature of each region.
Method 1: Calculating Variance utilizing the “VAR” Function
Step 1 – Choose a Targeted Cell
In statistical analysis, the VAR function is frequently employed to gauge the degree of variation present in a dataset. It is especially beneficial when we wish to compare two or more datasets to determine the degree to which they differ from one another. A low variance suggests that the data is closely clustered around the mean, while a high variance indicates that the data is more dispersed.
| VAR(range) |
- Choose a targeted cell to calculate the Variance.
Step 2 – Use the Function
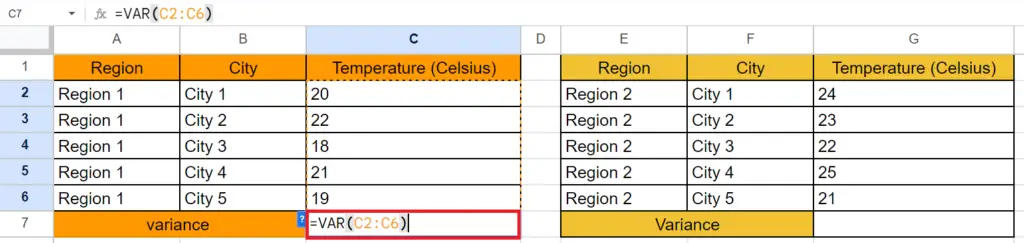
- Utilize the VAR function.
- The structure of the function will be:
VAR(C2:C7)
Step 3 – Hit the “Enter” key
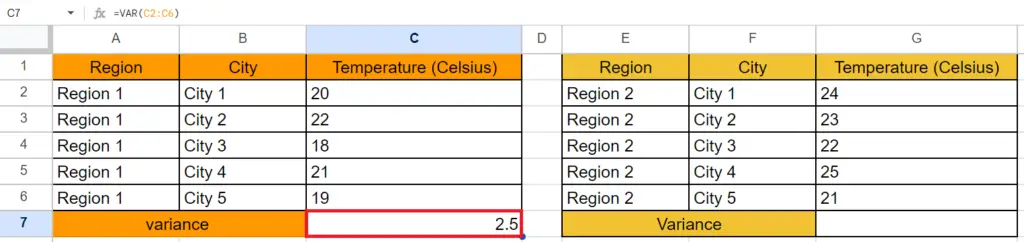
- To calculate the Variance, press the key labeled “Enter”.
Step 4 – Perform the Identical Set of Actions for the Second Region
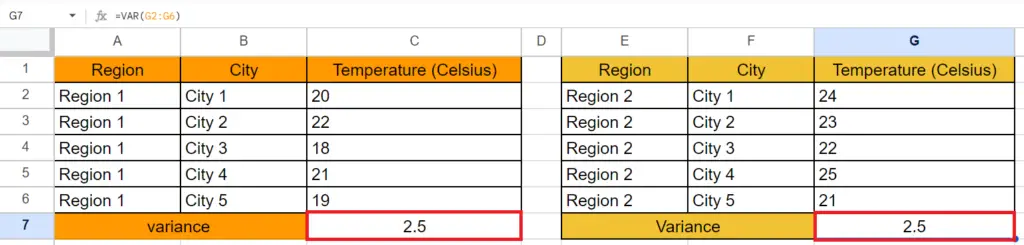
- Perform the identical set of actions for the second region.
Method 2: Calculating Variance of the Entire Population utilizing the “VARP” Function
The VARP function in Google Sheets is a valuable tool for determining the population variance when we have complete access to all the data. It is particularly applicable in statistical analyses when we want to calculate the variance of the whole population to draw effective conclusions about the population. This function can be used in a diverse array of statistical applications.
| VARP(range) |
Step 1 – Choose a Targeted Cell

- Choose a targeted cell for calculating the population variance.
Step 2 – Use the Function
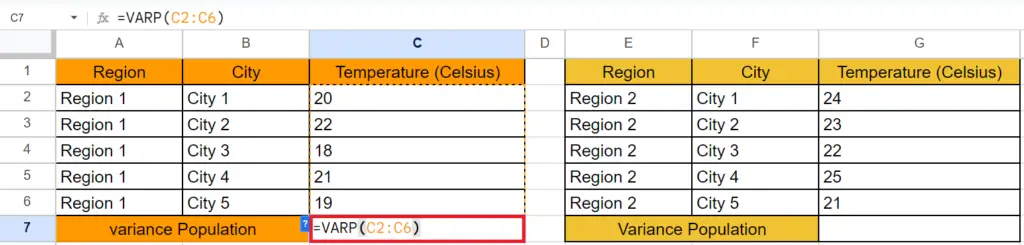
- Utilize the VARP function.
- The structure of the function will be:
VARP(C2:C7)
Step 3 – Hit the “Enter” key
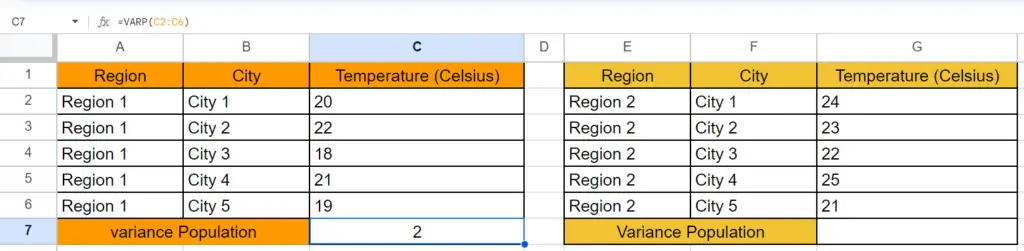
- For calculating the population variance, press the key labeled “Enter”.
Step 4 – Perform the Identical Set of Actions for the Second Region.
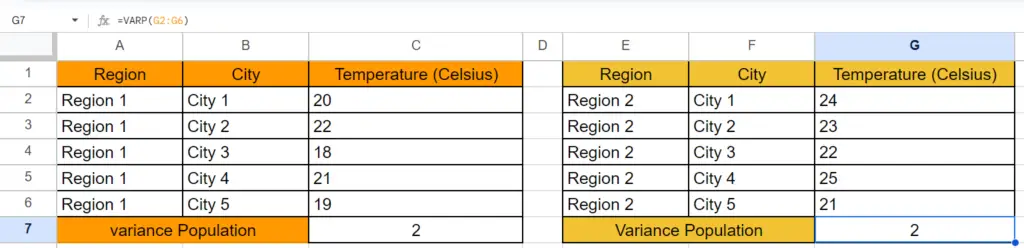
- Perform the identical set of actions for the second region.


