
How to calculate stock moving average in Excel
 By
SpreadCheaters
By
SpreadCheaters
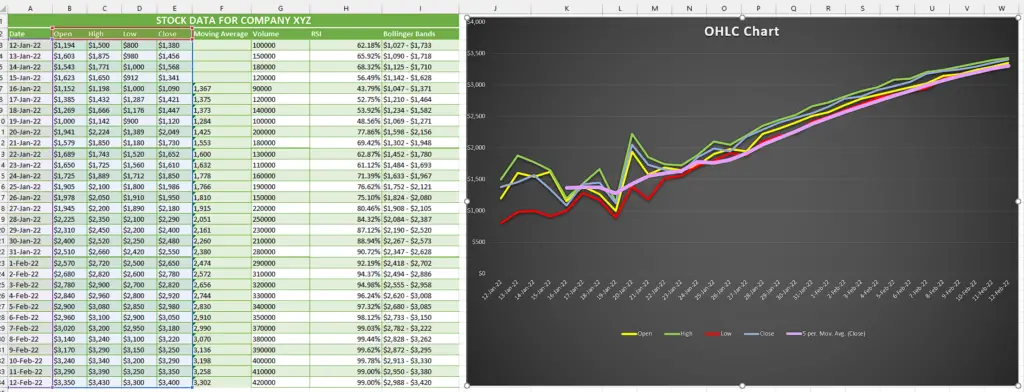
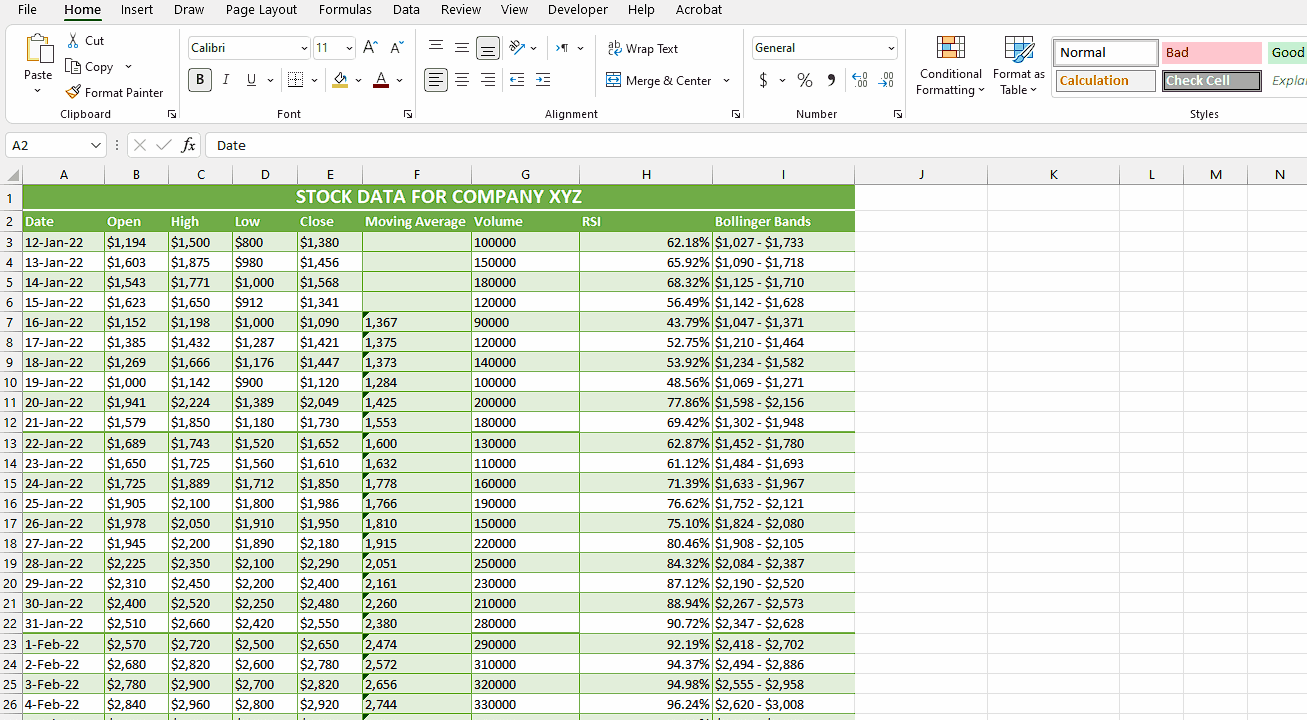
The provided data represents the stock market performance over a span of a month. It includes the opening and closing prices and the highest and lowest prices reached during each day. The volume column indicates the number of shares traded. The RSI (Relative Strength Index) offers insights into the stock’s momentum and overbought/oversold conditions, respectively. The Bollinger Bands show the range within which the stock’s price fluctuated, with the upper and lower limits indicated. In this tutorial, we will learn how to calculate the moving average using this data.
Understanding the Function and its syntax
The AVERAGE function is a mathematical function commonly used in spreadsheet software, including Excel, to calculate the average value of a set of numbers. It is also applicable for calculating the moving average of a series of data points.
The syntax of the AVERAGE function is as follows:
=AVERAGE(number1, [number2], …)
In this syntax, “number1”, “number2”, and so on represent the numerical values or cell references you want to include in the average calculation. You can consist of multiple numbers or cell references by separating them with commas.
When calculating the moving average, you can provide a range of values or cell references representing a specific period, such as a series of closing prices over a set number of days. The AVERAGE function will then sum up these values and divide the total by the number of data points, providing the average value for that period.
Explanation of Formula used in Step 2
In Step 2, the formula utilizes the AVERAGE function to calculate the moving average by summing up all the closing price data within a specified period and then dividing the total by the number of days. Since there is only one closing price per day, the number of closing prices corresponds to the number of days, making it suitable to use the AVERAGE function for this calculation.

Moving average in the stock market, known as a simple moving average (SMA), involves calculating the mean of a specific set of values within a designated timeframe. This method adds up the numbers or closing stock prices and divides the sum by the count of values in the set. It provides a smoothed average that helps identify trends and fluctuations in stock prices over time.
Step 1 – Selecting the cell
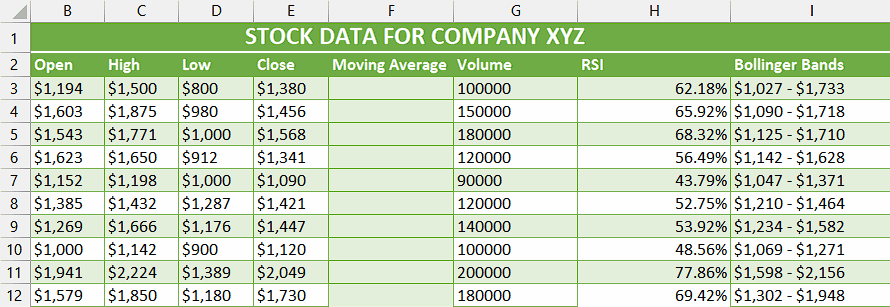
– Choose an empty cell, leaving out the number of adjacent cells equal to the desired moving average interval.
– We will apply the AVERAGE function in this cell to calculate the simple moving average.
Step 2 – Write the formula and implement it
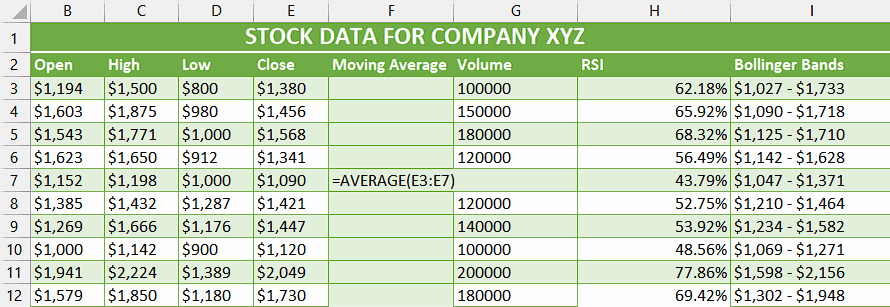
– In the selected cell, type = (equal sign).
– Then, write AVERAGE and select AVERAGE Function by using Tab Button.
– Next, choose the group of cells that encompasses the closing prices of the most recent 5 days (or any desired number of days) for which you wish to compute the moving average.
– Then, close the parenthesis and your formula would look like this.
Step 3 – Implement the formula to the whole range
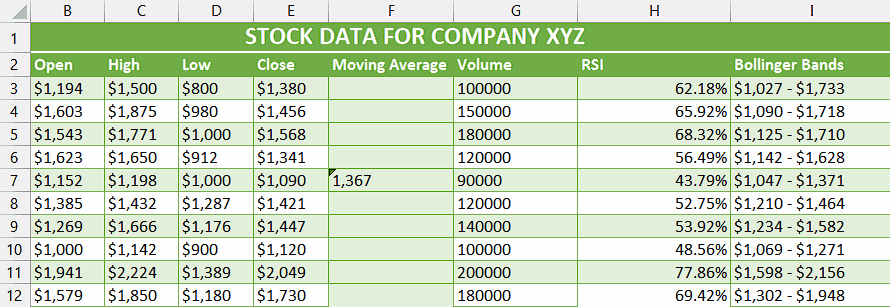
– To apply the formula across a range of cells, begin by selecting the cell containing the desired result, such as cell F7.
– Next, navigate to the bottom right corner of the cell until your cursor transforms into a black plus (+) shape, known as the fill handle.
– Double-Click on this fill handle and the formula would be applied to the whole range.
– The subsequent cells’ moving average is calculated in a way that the formula includes an additional value from the cell below and excludes the first closing price, continuing this pattern.
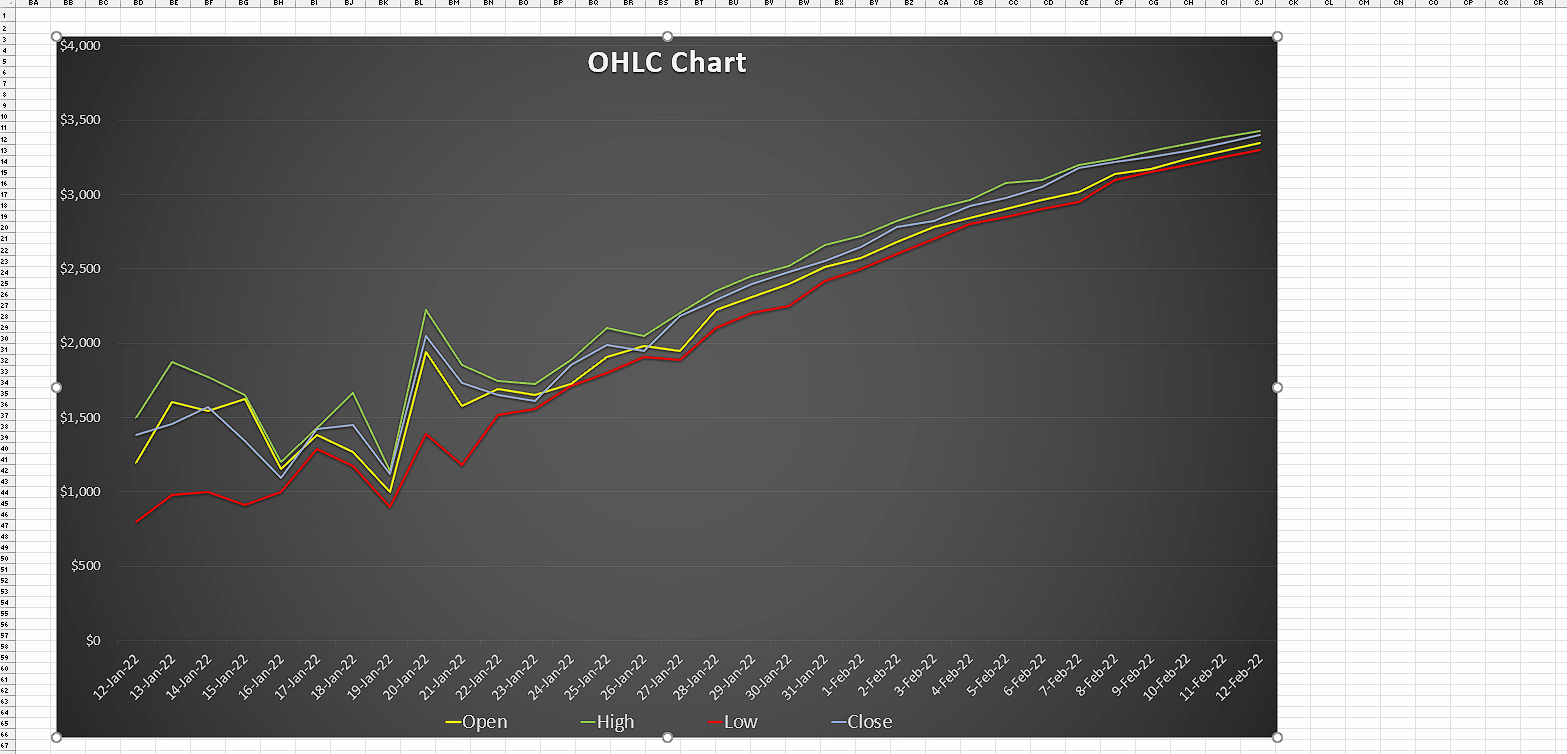
Step 4 – Insert a Line Chart
– Select the range containing dates and OHLC values.
– Then, navigate to the “Insert” Tab and click on the “Line charts” command button.
– Now, click on the 2D Line Chart.
– A Line chart will be inserted.
Step 5 – Add a Trendline
– Click anywhere inside the chart to select it.
– Now, click on the “Plus (+)” icon on the top right corner of the Chart which is called “Chart Elements”.
– Then, click on the box adjacent to the trendline option to check it.
– It will open a dialogue box.
– Click on the “Close (Closing Price)” option in the Dialogue box.
– After that, click on “OK”.
Step 6 – Convert Trendline to Moving Average
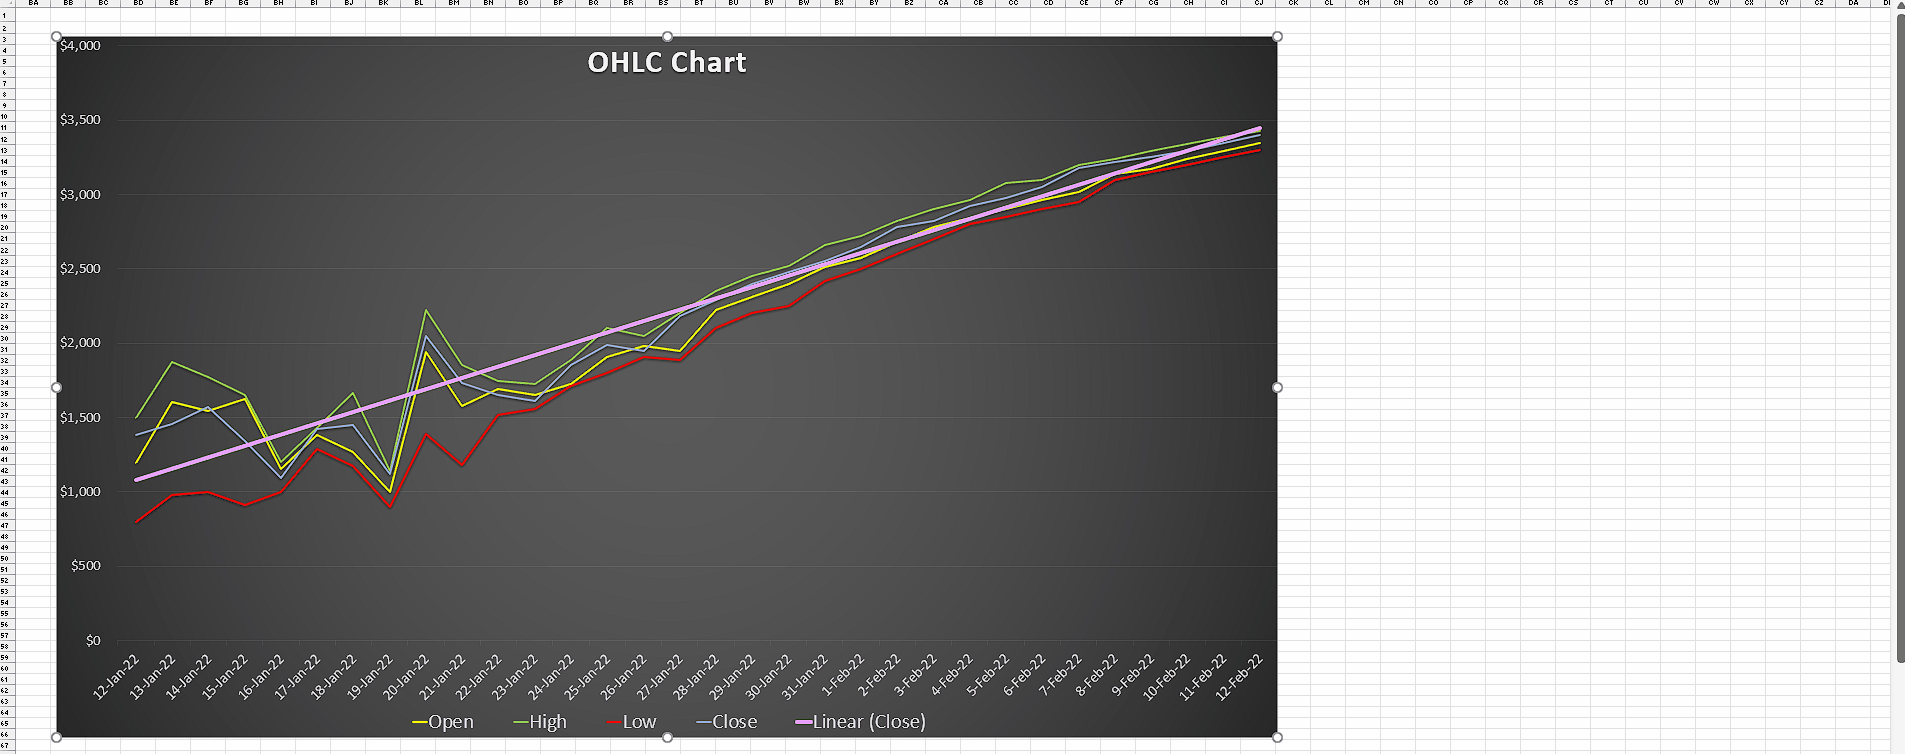
– Now, double-click on the line that we inserted, and it will open the “Format Trendline” sidebar.
– Then, click on the “Moving Average” option.
– Adjust the period to match the desired interval for calculating the moving average. As an example, let’s set the period to 5.
– Now, the Moving Average Trendline will appear on your screen.


