
How to calculate p-value in Google Sheets
 By
SpreadCheaters
By
SpreadCheaters
In this tutorial, we will learn how to calculate p-values in Google Sheets. In Google Sheets calculating p-values is a useful task. For this, the TTEST function is the most commonly used function. A small p-value (typically less than 0.05) suggests that the observed effect or difference is unlikely to have occurred by chance alone, and therefore the null hypothesis can be rejected in favor of an alternative hypothesis.
Let’s say a company has launched a new advertising campaign and claims that it has increased sales of its product. To test this claim, the company conducts a study in which it randomly selects two groups of customers: one group is shown the new advertisement and the other group is not shown any advertisement. The sales of both groups are listed for which we will be calculating the p-value.

P-values are a useful tool in statistical analysis that can provide insights into the significance of observed effects or differences. With the help of Google Sheets, users can easily calculate p-values for a variety of statistical tests and data types, making it a valuable resource for data analysis and research.
Step 1 – Select a Blank Cell
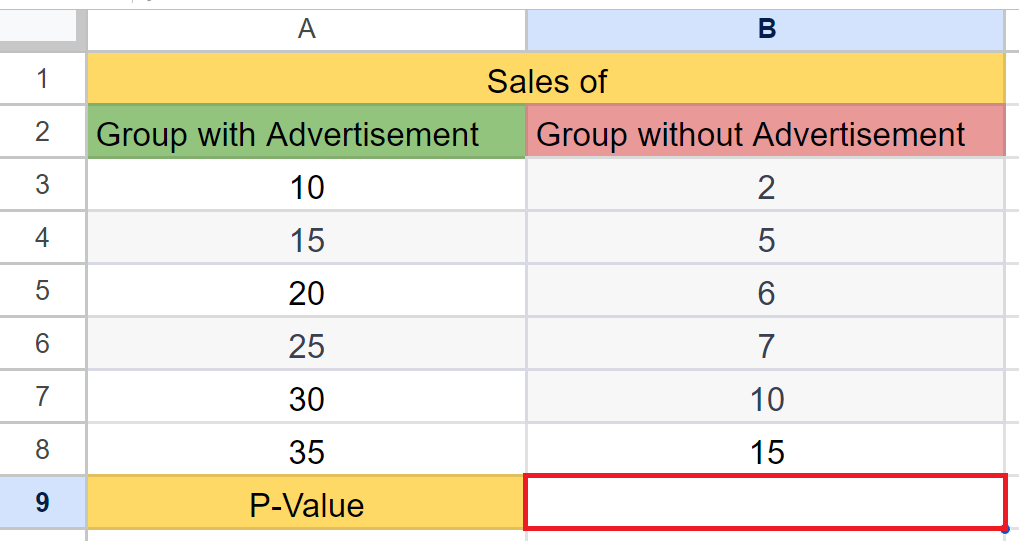
– Select a blank cell where you want to calculate the p-values.
Step 2 – Place an Equals Sign
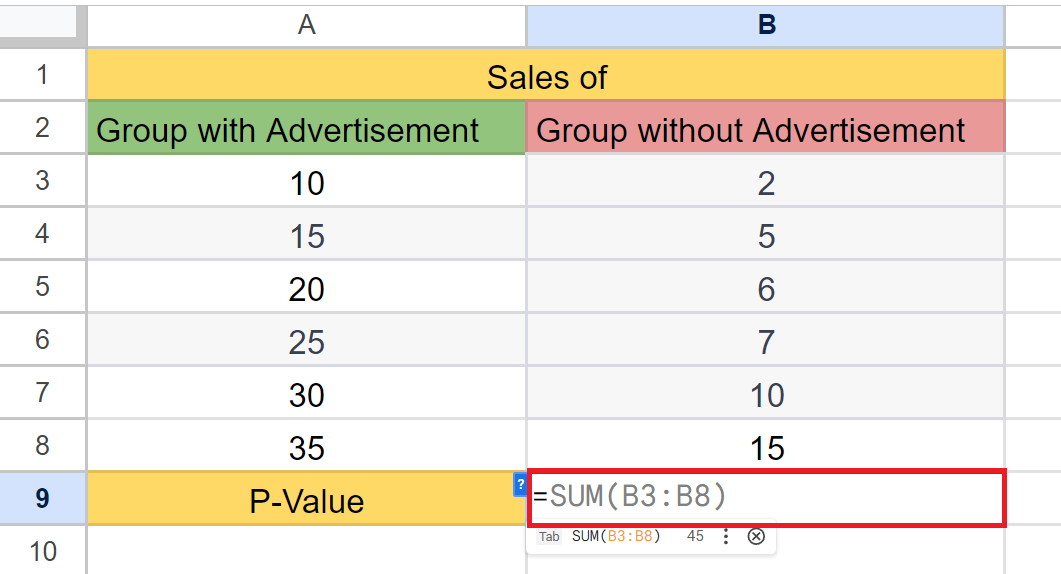
– Place an Equals sign in the cell.
Step 3 – Use the T.TEST Function
– Enter the T.TEST function next to the equals sign.
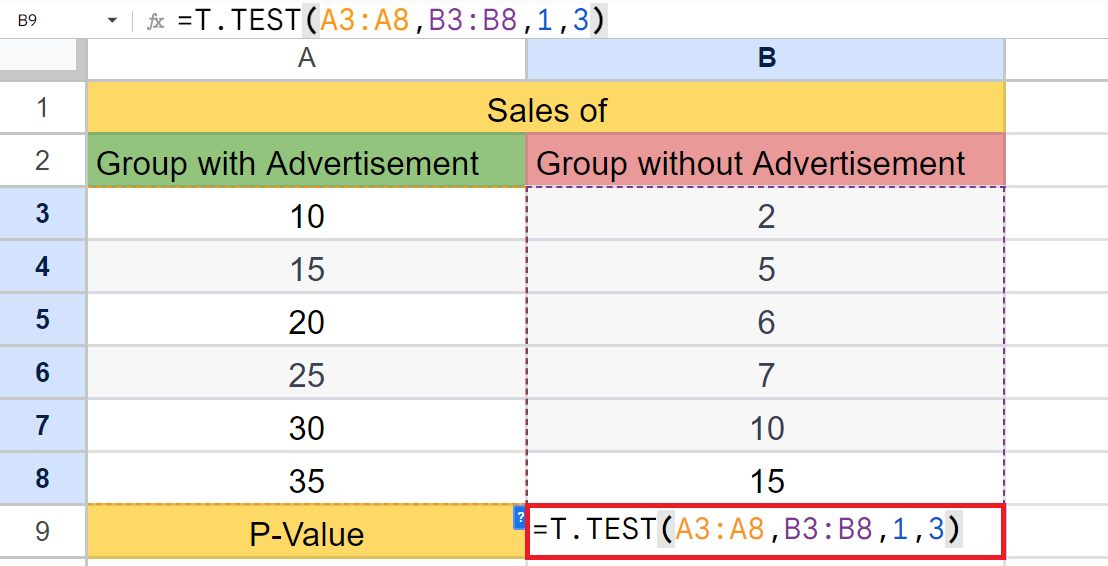
– The syntax of the T.TEST function will be,
T.TEST(A3:A8,B3:B8,1,3)
Where the first two arguments i.e. A3:A8 and B3:B8.
The third argument is the Distribution tail i.e. 1 – (One Distribution tail), 2 – Two Distribution tails).
The fourth argument is the type i.e. 1 – (paired test), 2 – (equal two-sample test), 3 – (unequal two- sample test).
Step 4 – Press the Enter Key
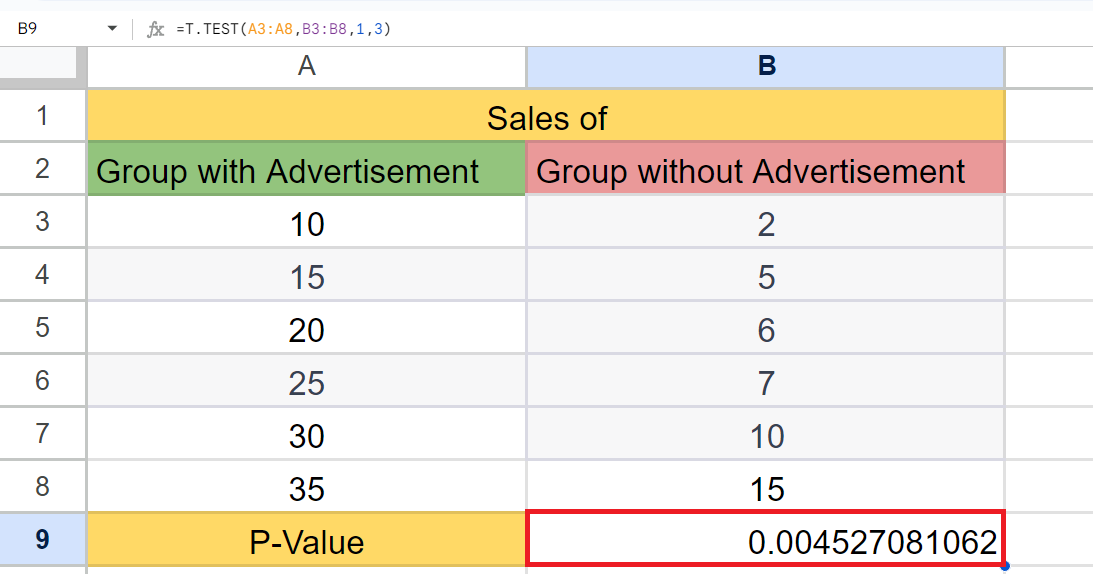
– Press the Enter Key to calculate the p-value.
Conclusion:
A p-value of 0.004 obtained from a two-sample t-test suggests that there is a statistically significant difference between the mean sales for the two groups (sales with ads and sales without ads). However, it does not necessarily mean that the sales of the group with ads have increased due to the ads themselves.
There could be other factors that have influenced the difference in sales between the two groups, and further analysis may be needed to determine the specific factors that are driving the observed difference. Additionally, the effect size of the difference should also be considered to determine the practical significance of the findings.
In summary, a statistically significant difference in mean sales between the two groups does not necessarily imply a causal relationship between the ads and the sales increase. Further investigation and analysis would be needed to draw such conclusions.


