
How to calculate cumulative probability in Excel
 By
SpreadCheaters
By
SpreadCheaters
This tutorial will demonstrate how to utilize the NORM.DIST function in Microsoft Excel to calculate cumulative probability. Consider a data sheet that includes the of customers and the total price of their purchases. In this scenario, calculating the cumulative frequency of purchase amounts helps in identifying the point at which a certain percentage of total sales is reached.
Calculating the Cumulative Probability in Excel Utilizing NORM.DIST Function.
The NORM. The DIST function in Excel has a cumulative argument that determines its behavior. When set to TRUE, it returns the cumulative distribution function, and when set to FALSE, it returns the probability density function.
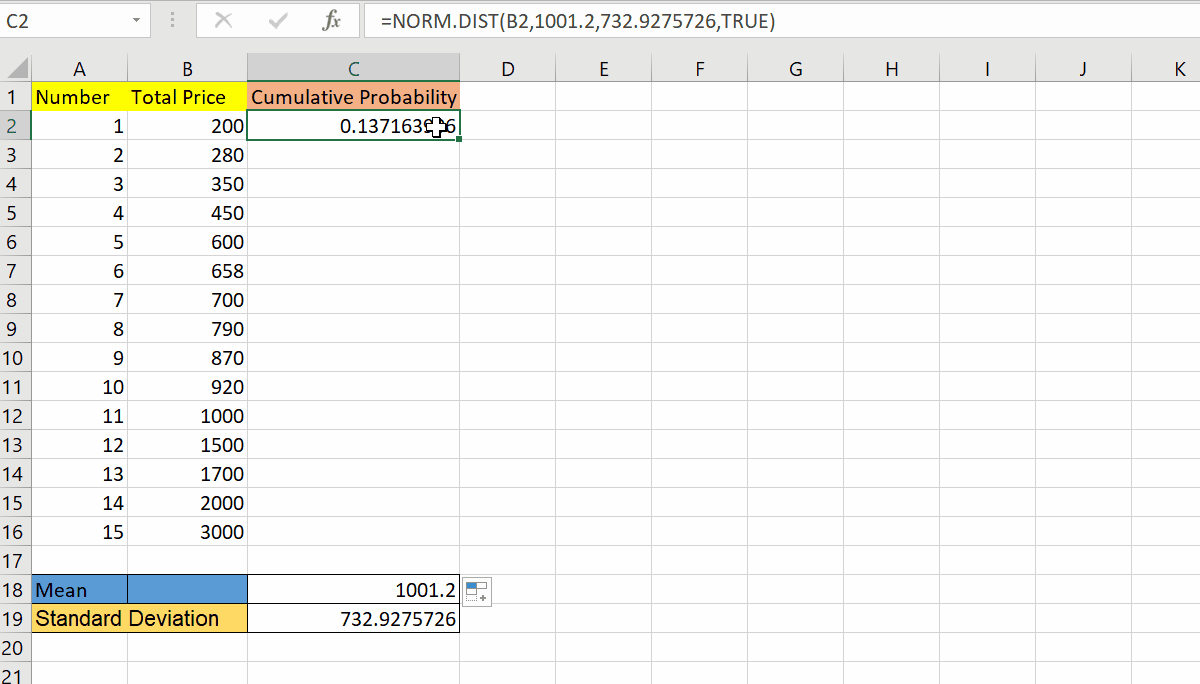
Cumulative probability in Excel calculates the likelihood of a random variable being less than or equal to a given value. It is important for risk assessment, decision-making, statistical analysis, and simulation modeling.
Step 1 – Select the Data and Locate Data Tab
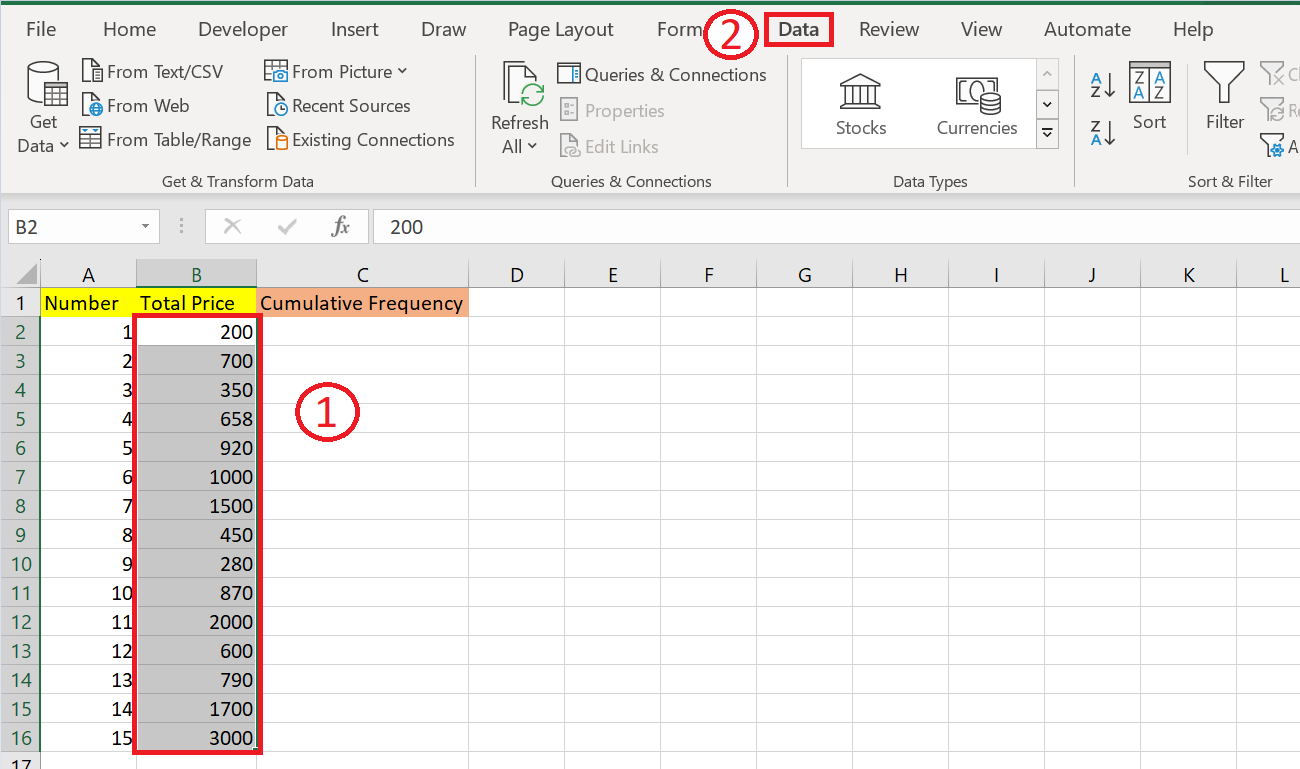
– Select the data
– Go to the Data tab in the menu bar.
Step 2 – Select the Icon “Smallest to Largest”
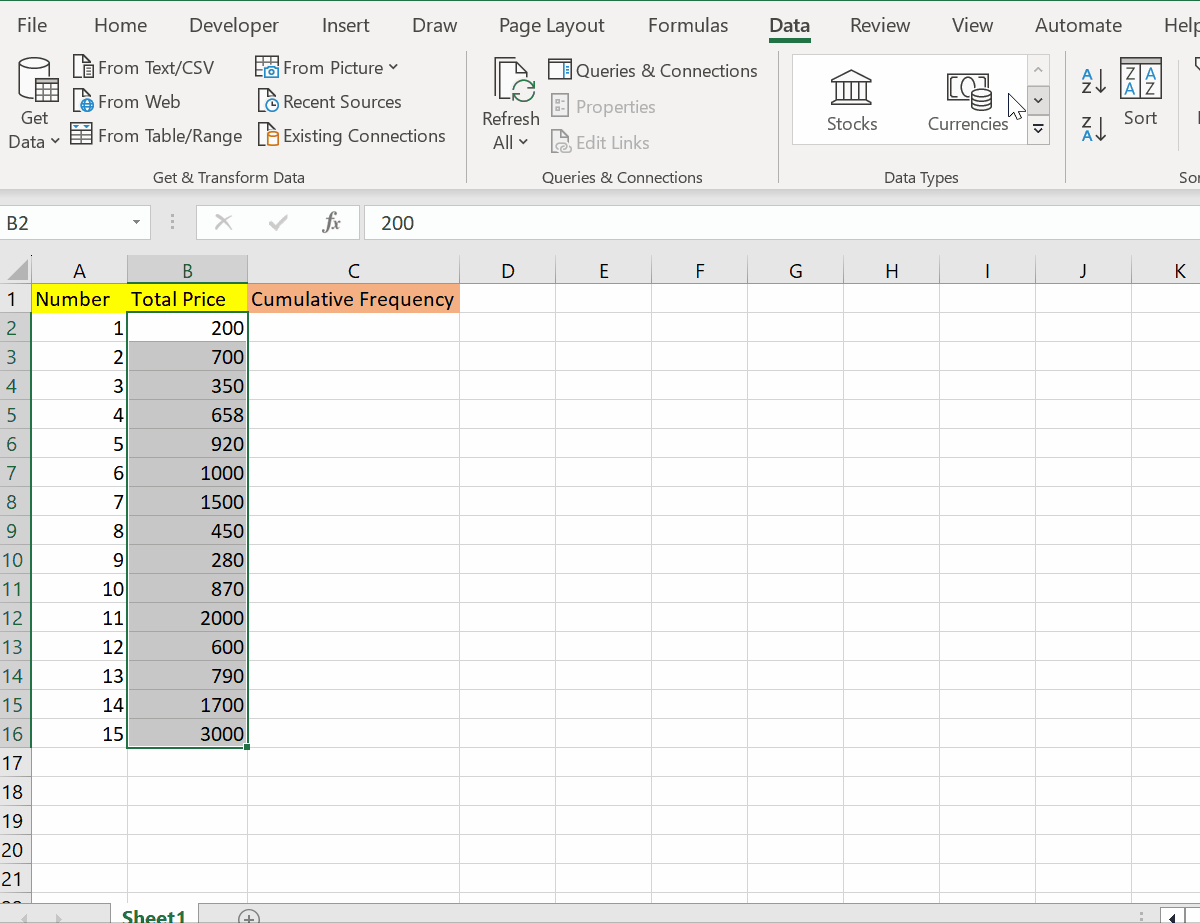
– Then select the icon from smallest to largest.
Step 3 – Calculate the Mean of the Dataset Utilizing Average Function
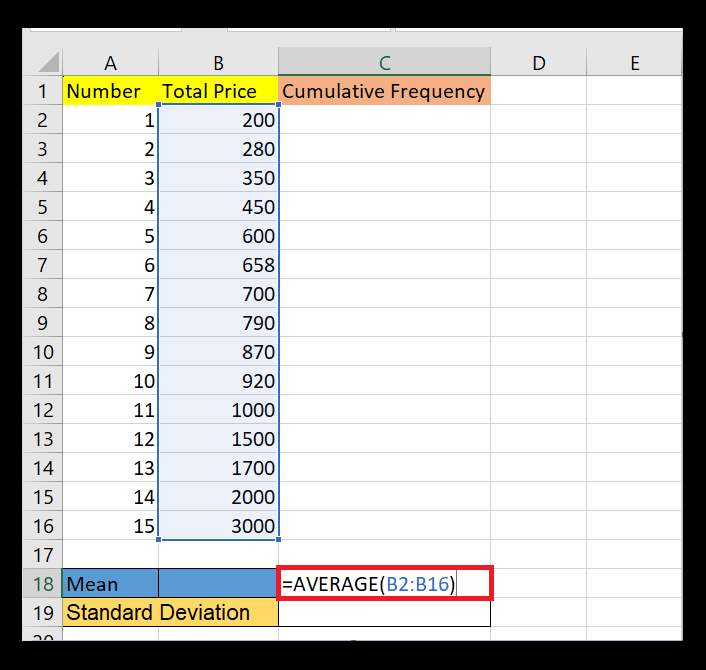
– Firstly write the following formula in the empty cell.
=AVERAGE(B2:B16)
– Then hit Enter.
Step 4 – Calculate the Standard Deviation Of Dataset
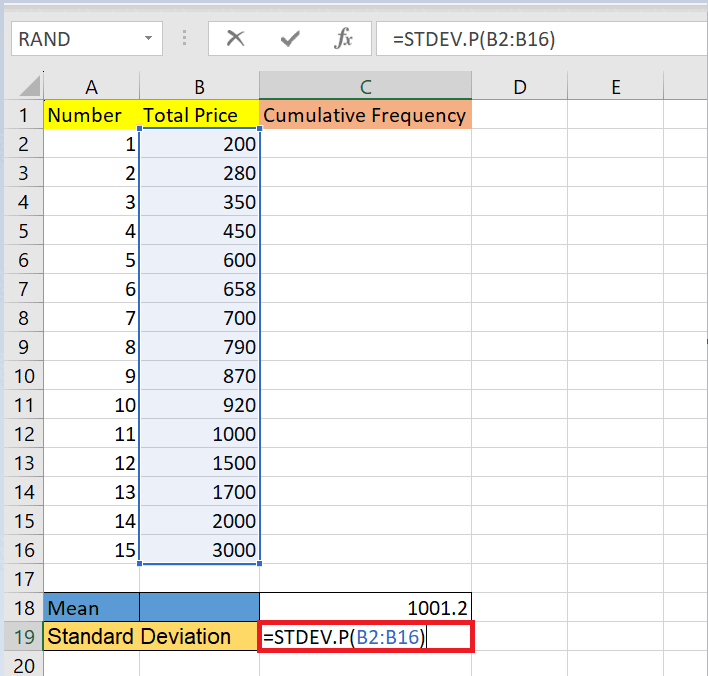
– Enter the following formula in the empty cell.
– Then hit Enter to get output.
Step 5 – Select the Cell
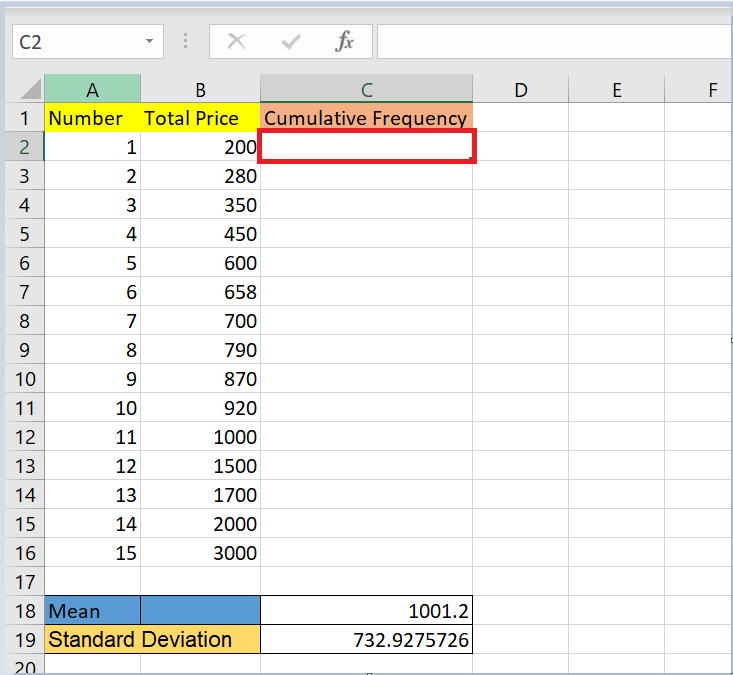
– Select the cell where you want to implement the formula.
Step 6 – Enter the Formula in Formula Bar
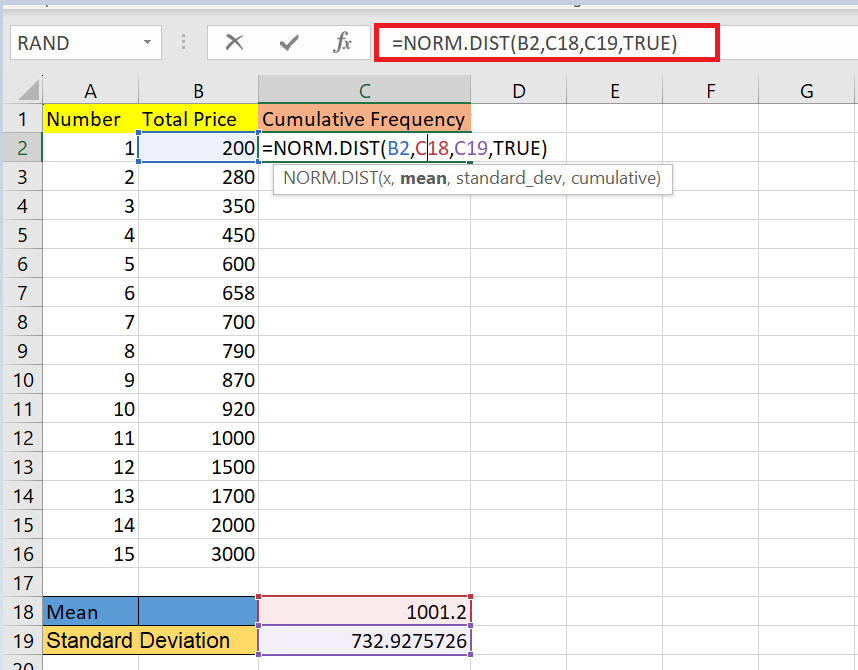
– Enter the following formula in the formula bar.
Step 7 – Hit Enter
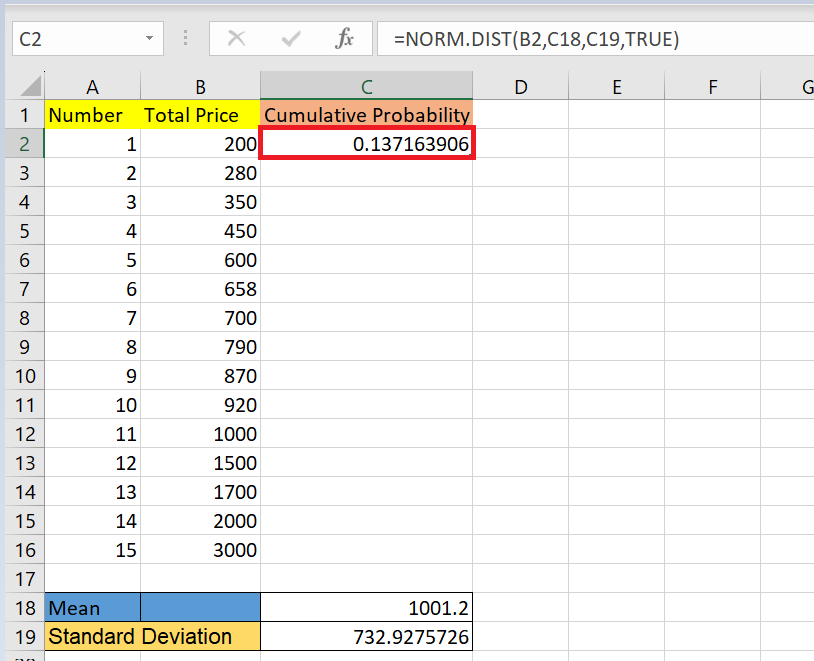
– Hit Enter to get output.
Step 8 – Use AutoFill
– Utilize autofill to implement the formula in the required cells.


