
How to add series in Google Sheets
 By
SpreadCheaters
By
SpreadCheaters
In Google Sheets, you can create charts with multiple series to display and compare data from different sources or categories. Multiple series can be plotted on a single chart, allowing you to visualize patterns and relationships between the data points. By using colors, labels, and different chart types, you can make the chart easier to read and interpret and gain insights into the data.
In this tutorial, we will learn how to add series in Google Sheets. In Google Sheets, there are several ways to add a series to a chart. One way is to modify the data range in the Chart Editor, and then select the new series from the “Add series”. You can also add a new series to an existing chart by selecting the chart and using the “Add series” option in the Chart editor.
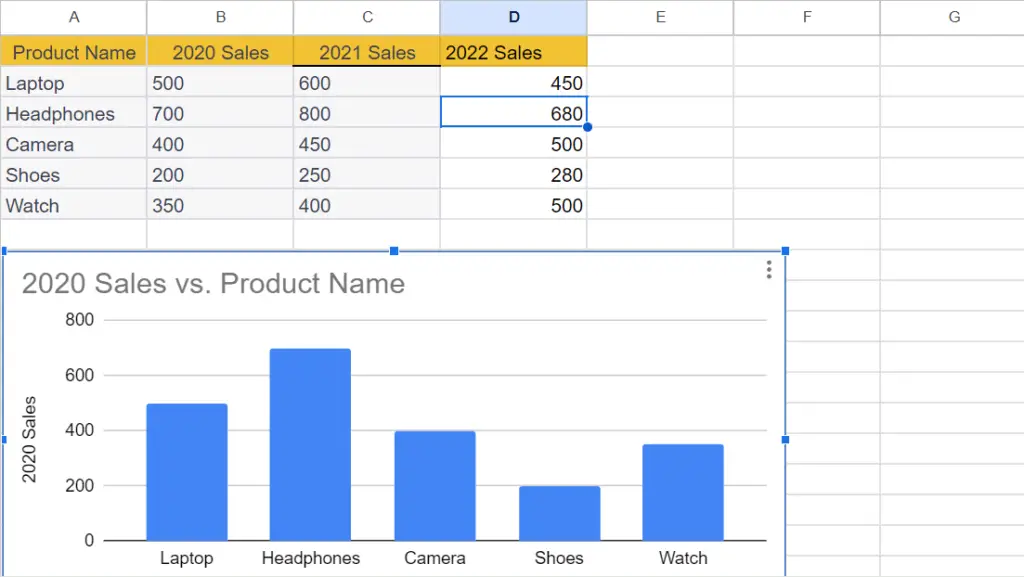
Currently, we have a chart showing sales of some products for the year 2020. We will add the sales for the year 2021 using the first method and for the year 2022 using the second method.
Method 1: Adding a Series by Modifying the Data Range
Step 1 – Double-Click on the Chart
- Double-click anywhere on the chart.
- This will open the Chart Editor pane on the right of the window.
Step 2 – Modify the Data Range in the Setup Tab
- In the Setup tab of the Chart Editor locate the “Data range” field.
- Replace the existing range with the new data range that includes the new series.
- By doing this the new series will appear in the “Add Series” list. Before, only the existing series was listed i.e. 2020 Sales.
Step 3 – Click on the Add Series Option
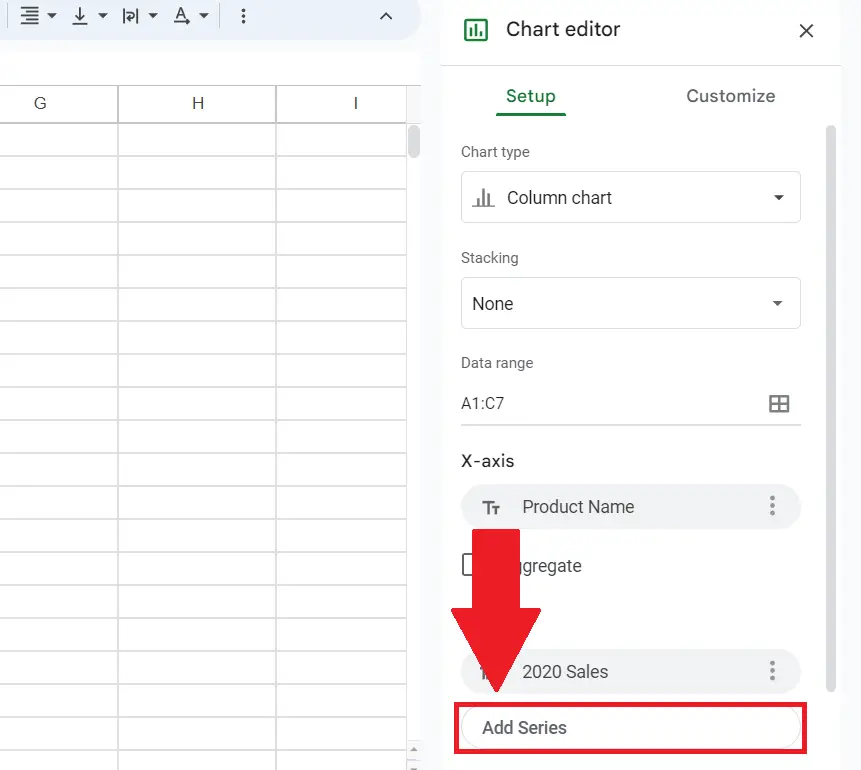
- Click on the “Add Series” option in the Series section.
- A series list will appear that will include the new series i.e. 2021 Sales.
Step 4 – Select the New Series
- Select the new series to be added.
- The series will appear in the chart.
Method 2: Adding a Series using the “Add Series” Option
Step 1 – Double-Click on the Chart
- Double-click anywhere on the chart.
- This will open the Chart Editor pane on the right of the window.
Step 2 – Locate the Add Series Option
- Locate the “Add Series” option in the “Series” section of the Setup tab.
- The Add Series list will appear.
Step 3 – Click on the Select a data range Icon
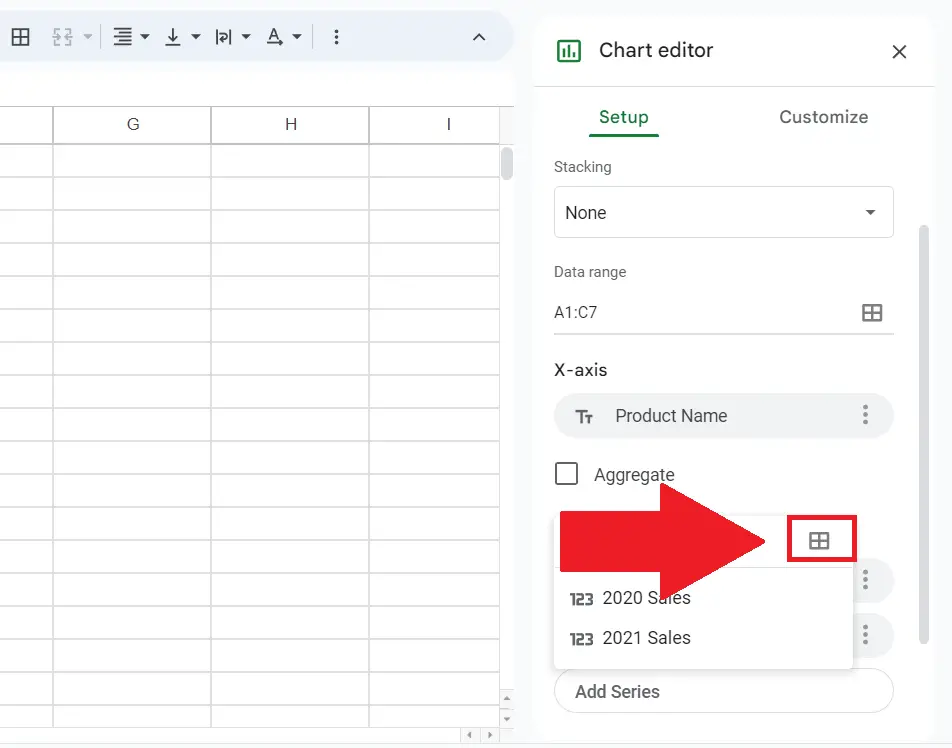
- Click on the “Select a data range” option in the top-right corner of the list.
- A dialog box will appear.
Step 4 – Input the Range and Click on OK
- Input the range of the new series to be added.
- Click on OK in the dialog box.
- The series will be added to the chart.


