
How to use the Slope function in Excel
 By
SpreadCheaters
By
SpreadCheaters
Excel has a built-in formula for this purpose which essentially implements the equation to calculate the slope of the straight line i.e.,

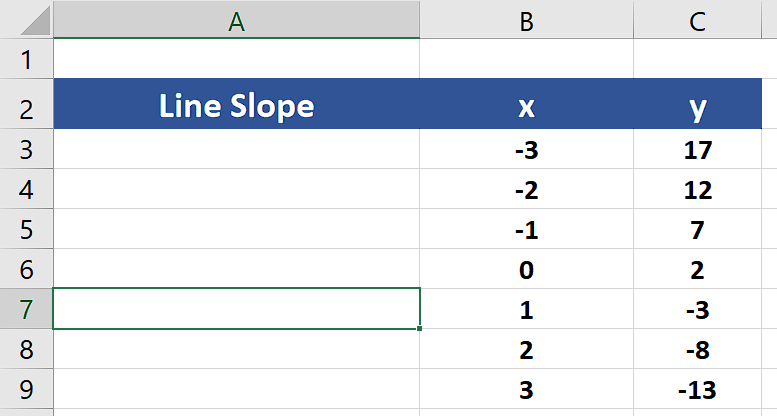
In this tutorial we’ll learn how to calculate the slope of the line using the SLOPE function in Excel, by following the steps below. Let’s look at the data set given below. We have the values for x-axis and y-axis already available in two columns.
Syntax of SLOP Function:
Let’s see the syntax of this function first.
SLOPE(known_y’s, known_x’s)
The SLOPE function syntax has the following arguments:
- Known_y’s
Required. An array or cell range of numeric dependent data points.
- Known_x’s
Required. The set of independent data points.
Excel has very powerful features for effective data visualization and presentation. It also provides us with specific tools that can help us solve some mathematical equations as well. Calculating the slope of the line is one such mathematical application.
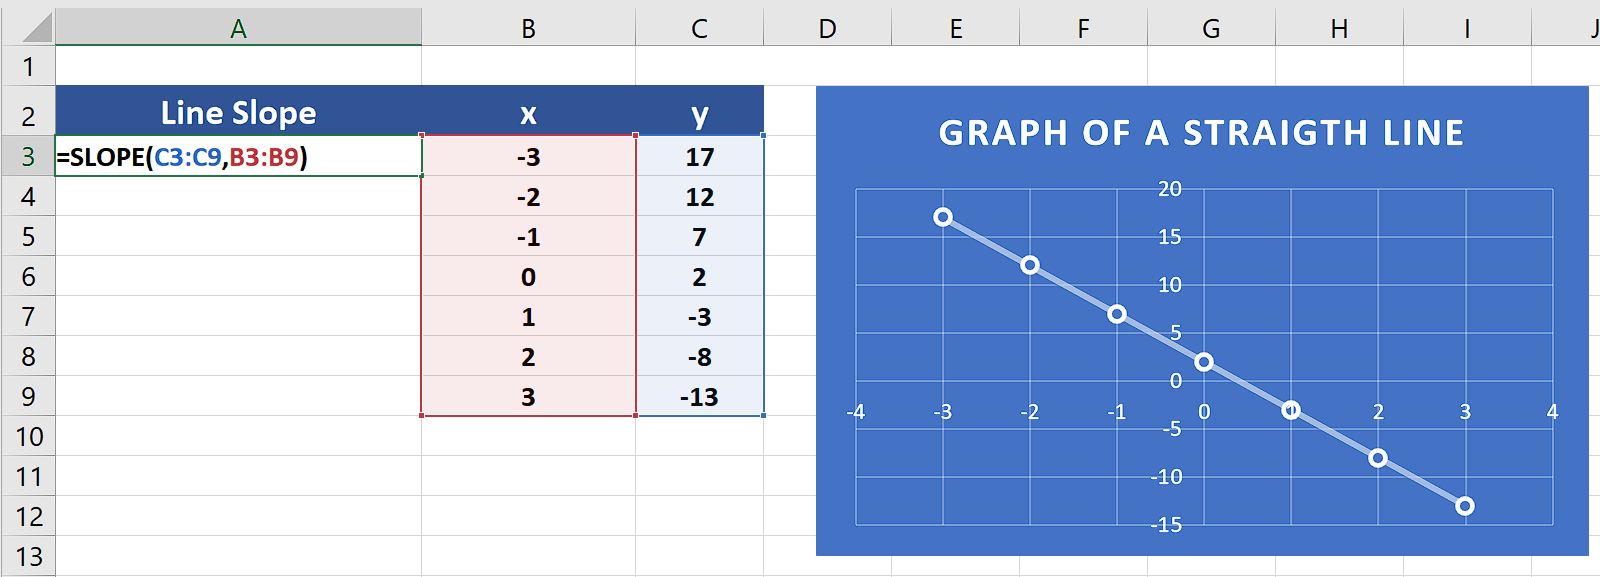
Step 1 – Create the formula using SLOPE

– We have the y-axis values in the cells from C3:C9 and the x-axis values in B3:B9. So, we’ll use the following formula to calculate the slope of the line generated from these values.
=SLOPE(C3:C9,B3:B9)
Step 2 – Implement the SLOPE formula
– We have the formula now and we will implement the formula just by pressing the enter button and the result will be shown in the desired cell.


