
How to use Harvey Balls in Excel
 By
SpreadCheaters
By
SpreadCheaters
Excel is a very powerful tool to perform mathematical and statistical calculations on numeric data. It also provides a variety of tools and functions to visualize the data quantitatively. One such tool which is widely used by data analysts is Harvey Balls. These are ideograms used to compare the data visually but in a quantitative manner.
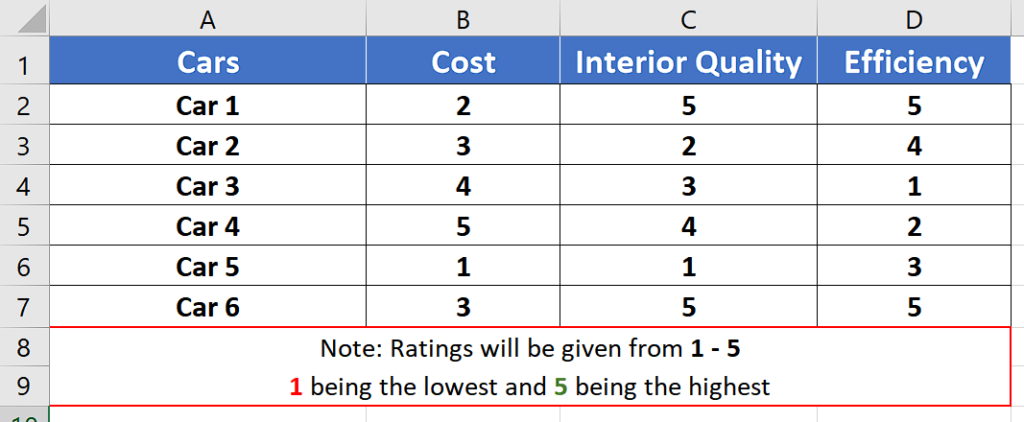
Let’s consider this dataset which tells about the features of some cars in a quantitative way. The easiest method to add a Harvey Balls representation to your data in Excel is to use conditional formatting. In today’s tutorial we’ll learn how to use Harvey Balls in Excel by using conditional formatting following the steps mentioned below.
Step 1 – Select quantitative data
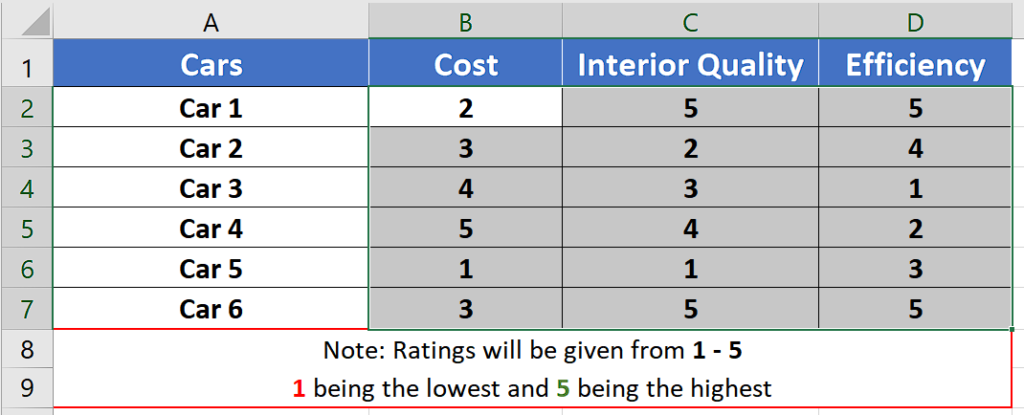
- As mentioned earlier, it is a data visualization tool, however, it requires quantitative data to work. Therefore, select only the quantitative data in your dataset, which in our case are the cells from B2:D7.
Step 2 – Choose 5 Quarters Icons from Conditional Formatting options
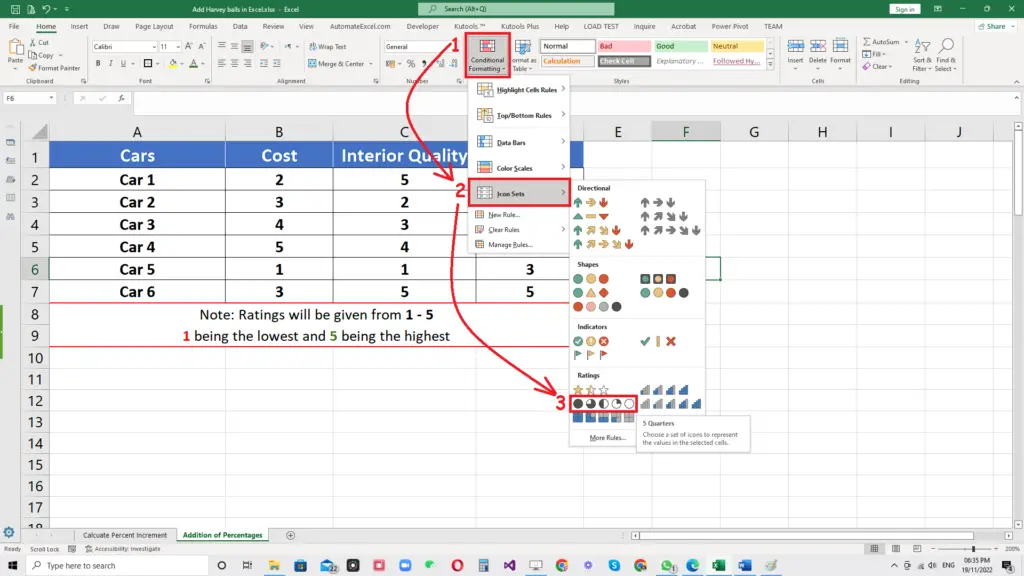
- In the HOME tab, locate the Styles group and click on the Conditional Formatting dropdown arrow.
- Now go to Icons options and in the Ratings select the 5 Quarters option.
Step 3 – Apply Harvey Balls icons to the data
- After selecting the quantitative data, when you will choose the 5 quarters icons in the last step, it will automatically apply the conditional formatting and you will see the Harvey Balls along with data as shown below;
So, this is how we can add Harvey Balls to our data.
Hide Data and show the Harvey Balls icons only
To make the data look more aesthetic, we can hide the numbers and show the icons only. If you wish to make the data disappear and keep the icons only then follow these extra steps as well.
Step 1 – Locate Manage Rules option in conditional formatting dropdown

- Select all the data with Harvey Balls with them.
- In the Styles group on the HOME tab, go to Conditional Formatting options and click on Manage Rules.
Step 2 – In Edit Rules, check the box for Show icon only option
- In the Conditional Formatting Rules Manager, click on the Edit Rule option.
- In the new dialog box, check the box against Show Icon Only and press OK.
- In the next dialog box press “Apply”. This will apply the condition you just selected and all data will disappear. Now only Harvey Balls will be visible making the data representation more aesthetic.


