
How to rotate graphs in Excel
 By
SpreadCheaters
By
SpreadCheaters
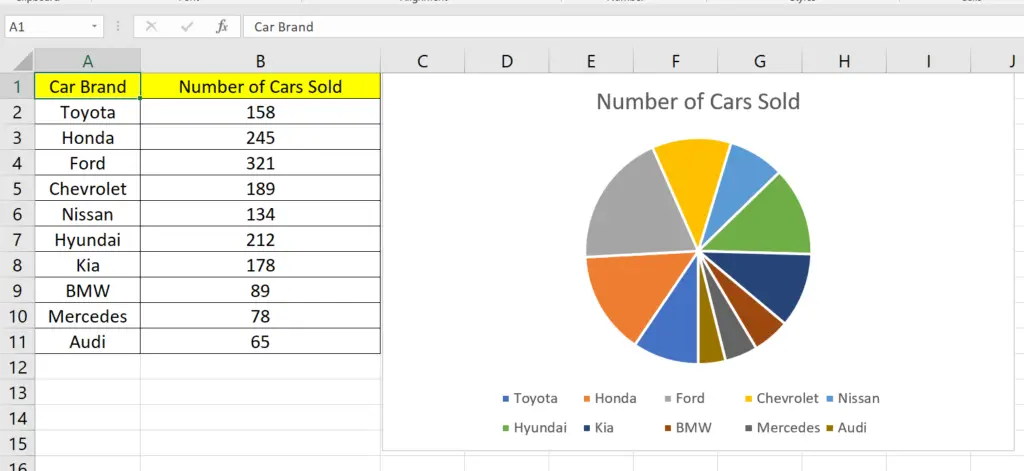
Here we have a dataset, in this dataset, we have a Car and its Quantities in the form of a Pie Chart. In this tutorial, we will learn how to rotate this chart in excel but first let’s take a look at the Dataset above.
Microsoft Excel is a powerful tool for data analysis and presentation, and one of its key features is the ability to create charts and graphs. However, sometimes you may want to rotate a graph to better display your data, or simply to change its orientation.
Step 1 – Selecting the chart
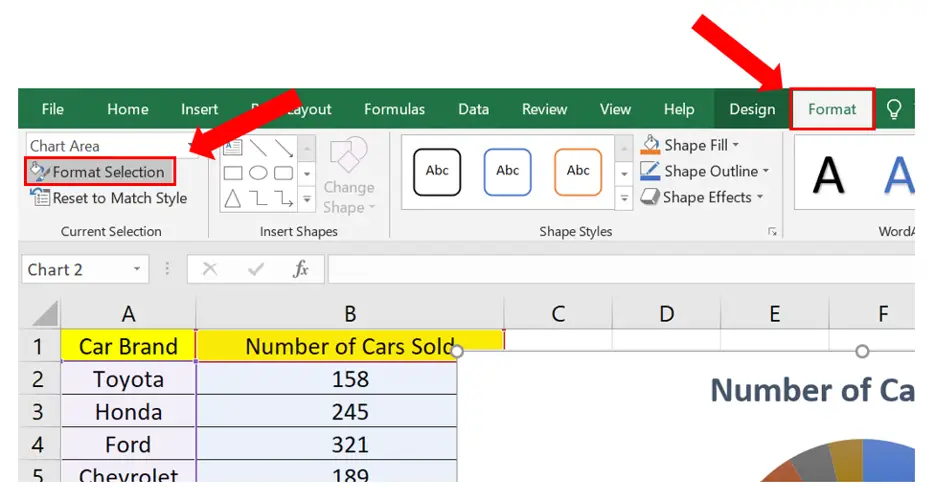
– Select the chart you want to rotate.
– Go to the Format tab.
– Click on the Format Selection command in the Current Selection group.
Step 2 – Changing the angle
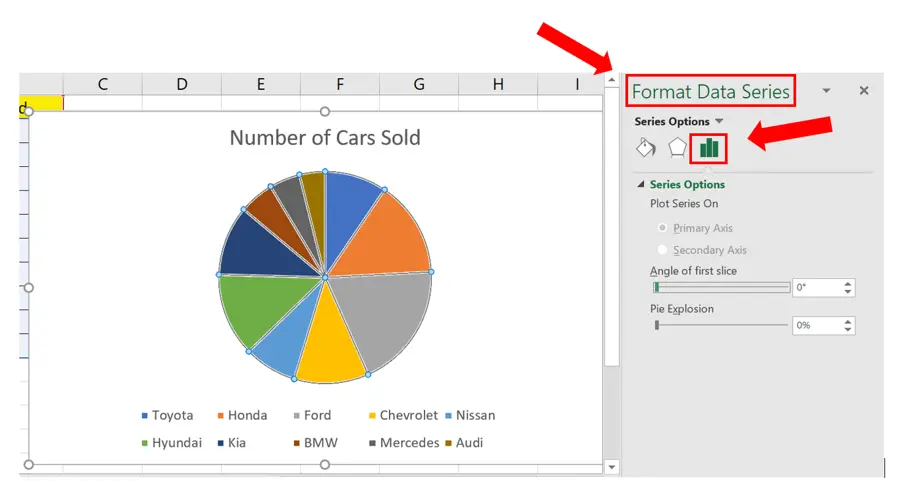
– Clicking on the Format Selection command will reveal the Format Data Series dialog box.
– Then click on the Series Option dropdown list.
Step 3 – Rotating the chart

– In the Series Option dropdown list, click on the Angle Of The First Slice command.
– Change the angle to 180°.
– This will rotate the chart.


