
How to resize a chart in Excel
 By
SpreadCheaters
By
SpreadCheaters
Page last updated:
03/01/2023 |
Next review date:
03/01/2025
You can watch a video tutorial here.
When a chart is created in Excel, it is created as an object. This means that it is not tied to a particular cell and is an independent entity that can be moved or resized according to the requirement. You may need to resize a chart to make it fit better on a sheet or to make the data displayed clearer for the reader.
Option 1 – Use the sizing handles
Step 1 – Select the chart
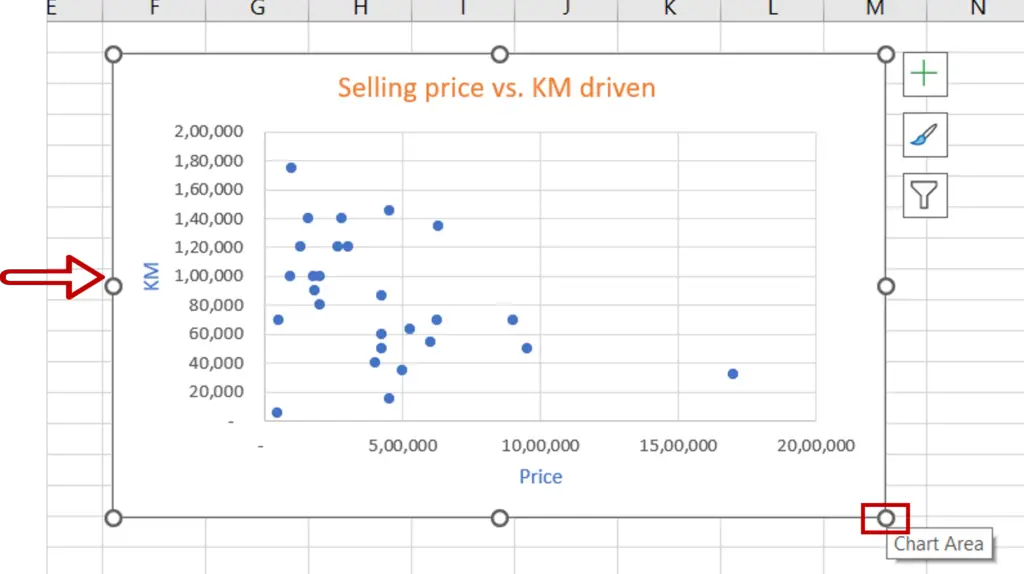
- Select the chart
- Move the pointer over the lower right corner of the chart till it changes to a sizing handle (double-sided arrow)
Step 2 – Drag the sizing handle
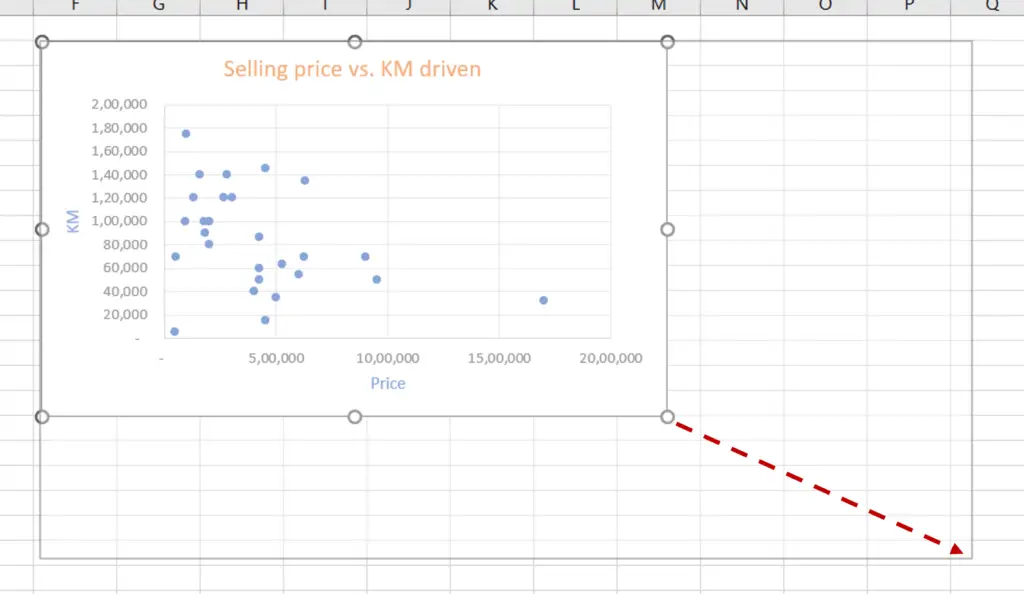
- Drag the sizing handle out to increase the size of the chart
- Release the sizing handle when the chart reaches the desired size
Step 3 – Check the result
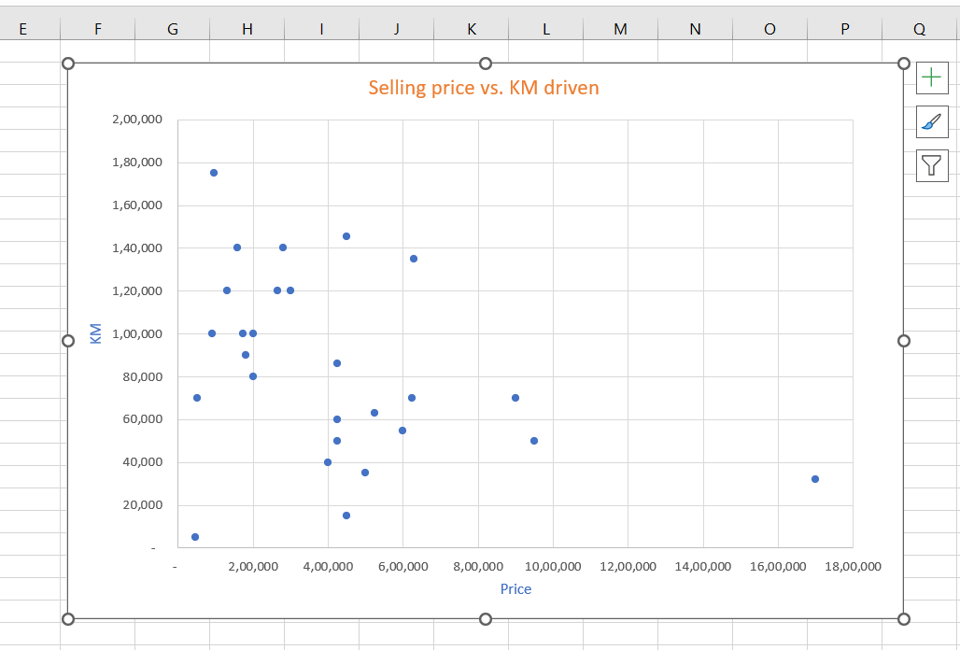
- The size of the chart is increased
Option 2 – Use the menu option
Step 1 – Summon the Format menu
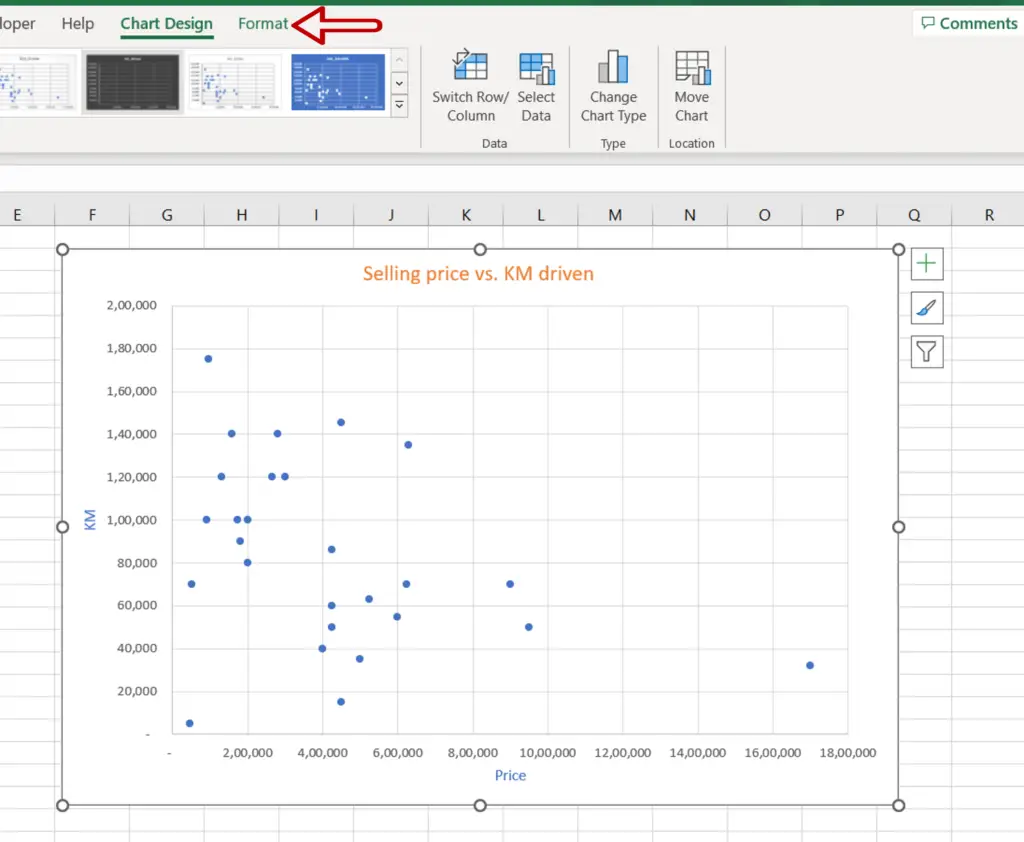
- Select the chart
- The Format menu option will appear
Step 2 – Resize the chart
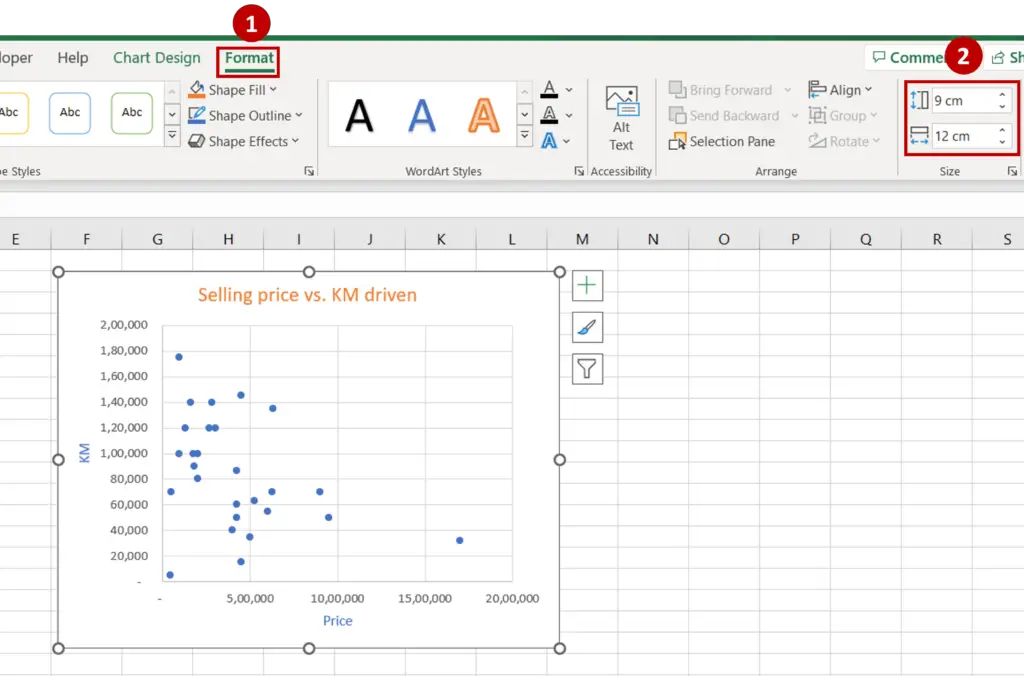
- Go to Format > Size
- Change the height and/or width of the chart using the arrow buttons or by typing the numbers
Step 3 – Check the result
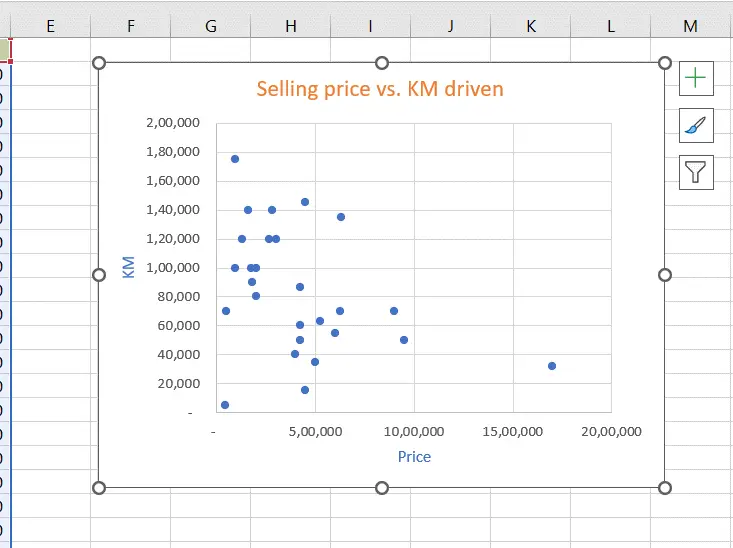
- The size of the chart changes according to the dimensions given


