
How to refresh a chart in Microsoft Excel
 By
SpreadCheaters
By
SpreadCheaters
Refreshing a chart in Excel means updating the chart’s data source with any changes made to the underlying data. When you create a chart in Excel, it is usually based on a range of cells or a table. If you make any changes to the data that the chart is based on, such as adding new data or changing existing data, the chart may not automatically update to reflect these changes.
In this tutorial, we will learn how to refresh a chart in Microsoft Excel. To update a chart in Microsoft Excel, we can click the Refresh All button in the Data tab. This will refresh the chart with any changes made to the source data. However, if we add a new row or column to the source data, we can update the chart by converting the data to a table. Excel will automatically read any new data added to the table, ensuring that the chart is always up to date.
Method 1: Refreshing the Data using the Refresh All Button
Step 1 – Make the Changes in Data Source
- Make the changes in the data source.
- Here we will replace the name of the student “Emma” with “Sarah”.
- Notice the name will not change in the chart.
Step 2 – Go to the Data Tab
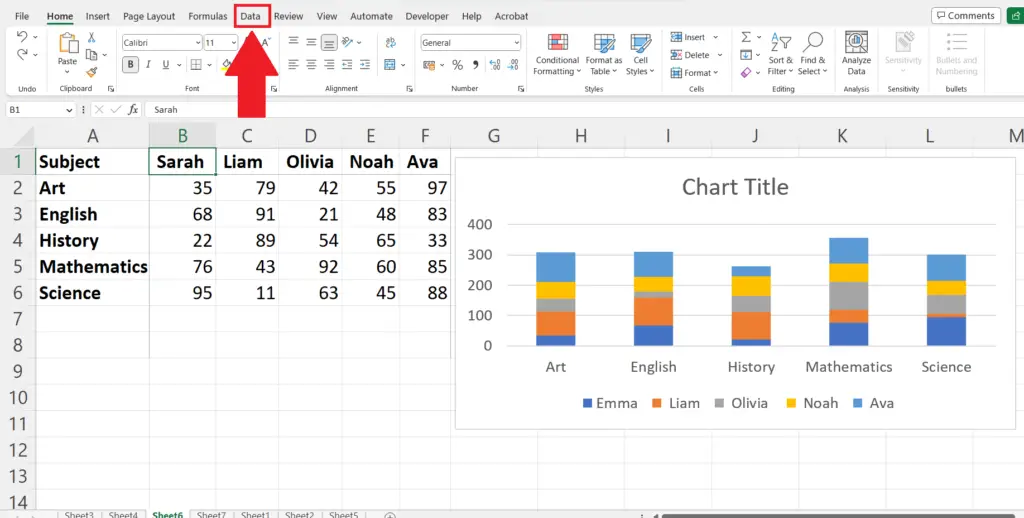
- Go to the Data tab in the menu bar.
Step 3 – Click on the Refresh all button
- Click on the Refresh All button.
- The chart will be updated according to the latest data source.
Method 2: Convert the Data into a Table and then Insert a Chart
Step 1 – Select the Data
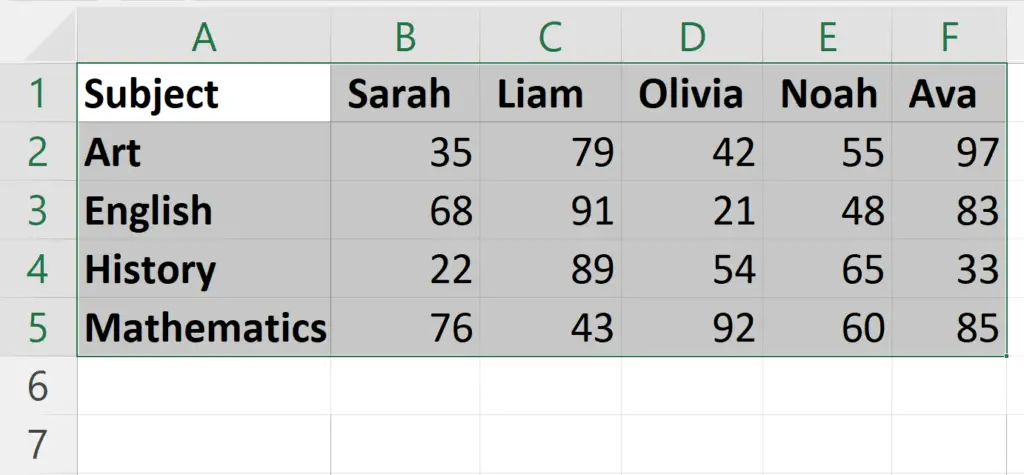
- Select the source data for the chart.
Step 2- Go to the Insert Tab
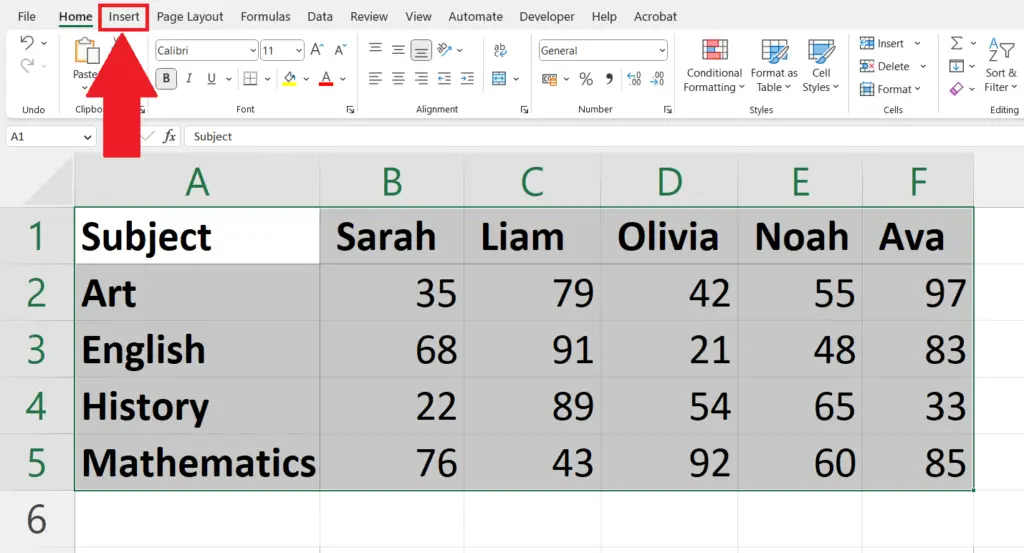
- Go to the Insert Tab in the menu bar.
Step 3 – Click on the Table Button
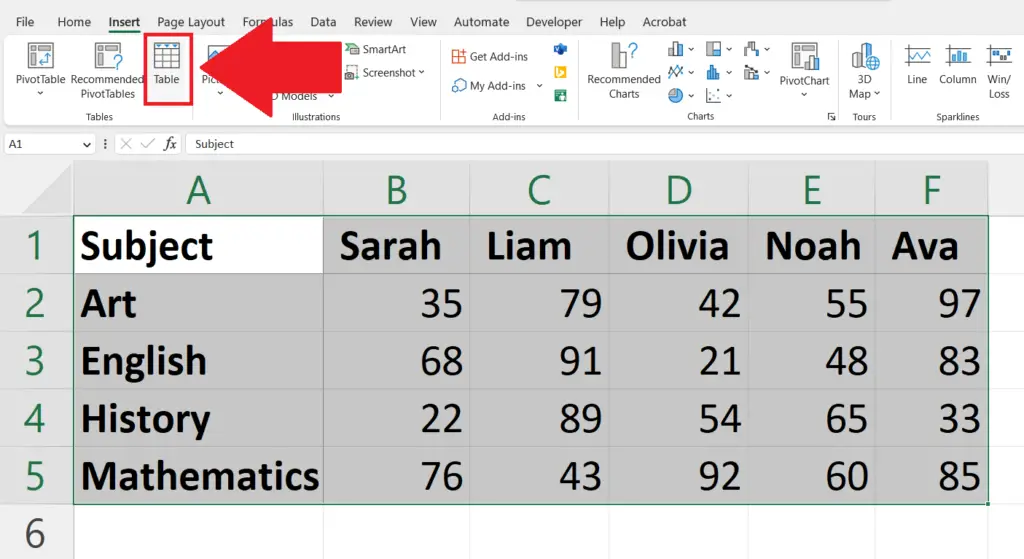
- Click on the Table button in the Tables section.
- The Create Table dialogue box will appear.
Step 4 – Click on OK
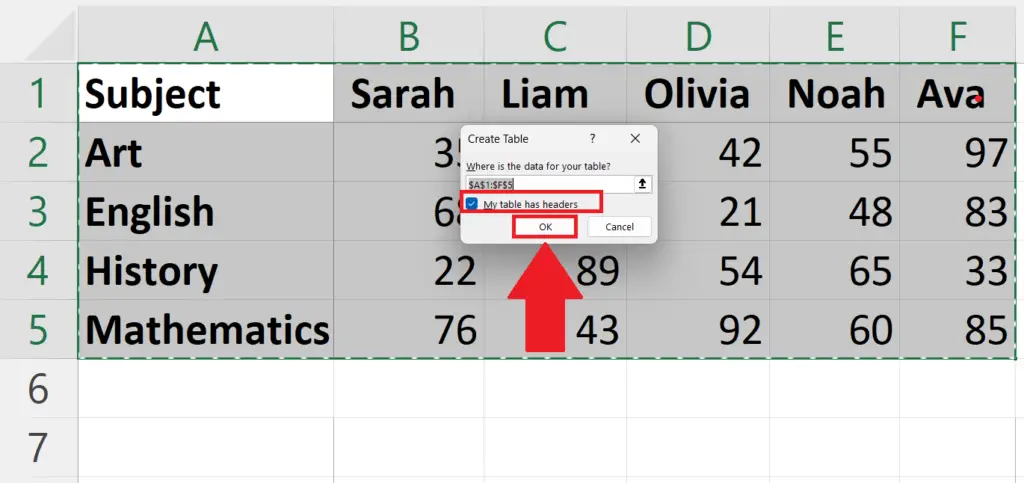
- Make sure to check the “My table has Headers” checkbox.
- Click on OK in the Create Table dialogue box.
- The table will be created.
Step 5 – Select the Table and Create a Chart
- Select the table containing the Data Source.
- Select a chart in the Charts section in the Insert menu.
- The chart will be created.
Step 6 – Now Add Row or Column
- Now add rows or columns in the table.
- The chart will automatically update the added data.


