
How to perform linear interpolation in Microsoft Excel
 By
SpreadCheaters
By
SpreadCheaters
In this tutorial we will learn how to perform linear interpolation in Microsoft Excel.Microsoft Excel offers multiple ways to perform linear interpolation, and for this purpose, we will utilize the FORECAST function.The FORECAST function is a built-in function in Microsoft Excel that can be used to perform linear interpolation and make predictions based on existing data. This function estimates a future value based on a linear trend calculated from a set of known x and y values.
The syntax for the FORECAST function is as follows:
FORECAST(x, known_y’s, known_x’s)
where:
x
It is the value which is not included in the dataset and for which we wish to find the value of y.
known_y’s
It is the set of known y values in the dataset.
known_x’s
It is the set of known x values in the dataset. At present, we possess a dataset where the values of both the dependent and independent variables are known. Our objective is to determine the value of the dependent variable when the independent variable equals 13.

Linear interpolation is a common method used in Excel to estimate a missing value or to interpolate a value between two existing data points. In simple terms, linear interpolation is a method of estimating a value between two known data points by assuming that the relationship between the two data points is linear or straight-line.
Step 1 – Select a Blank Cell
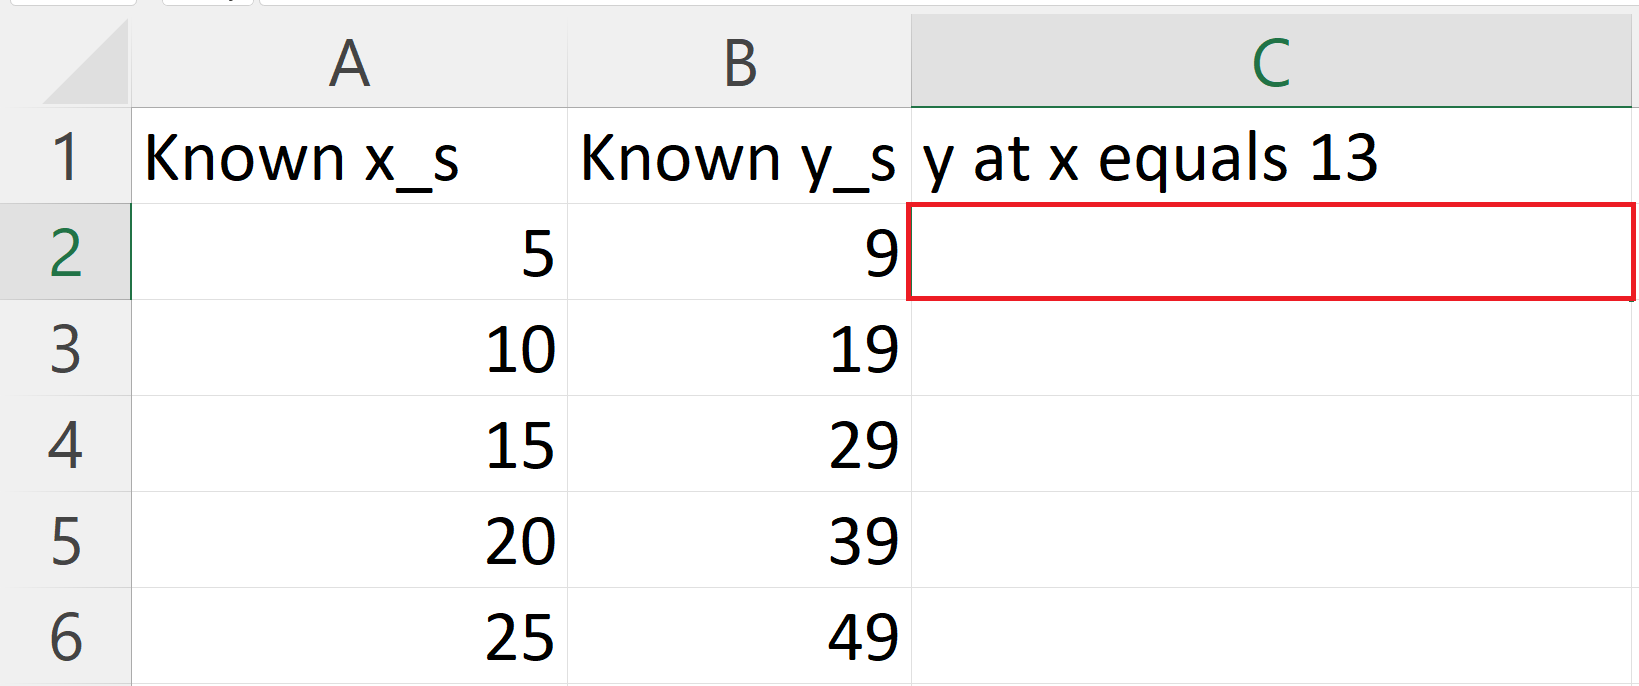
– Select a blank cell where you want to perform linear interpolation.
Step 2 – Place an Equals Sign
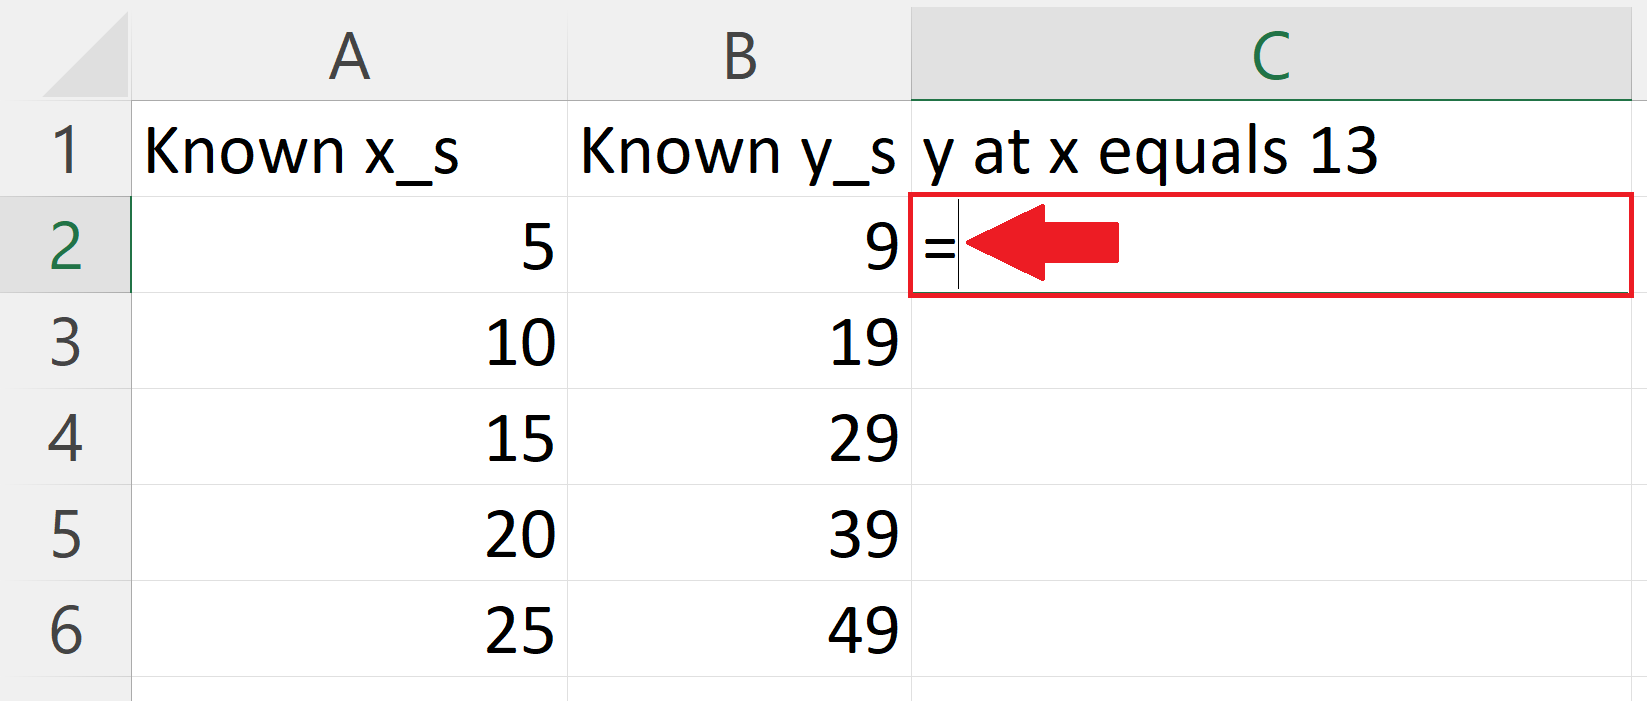
– Place an equals sign in the blank cell.
Step 3 – Use the FORECAST Function
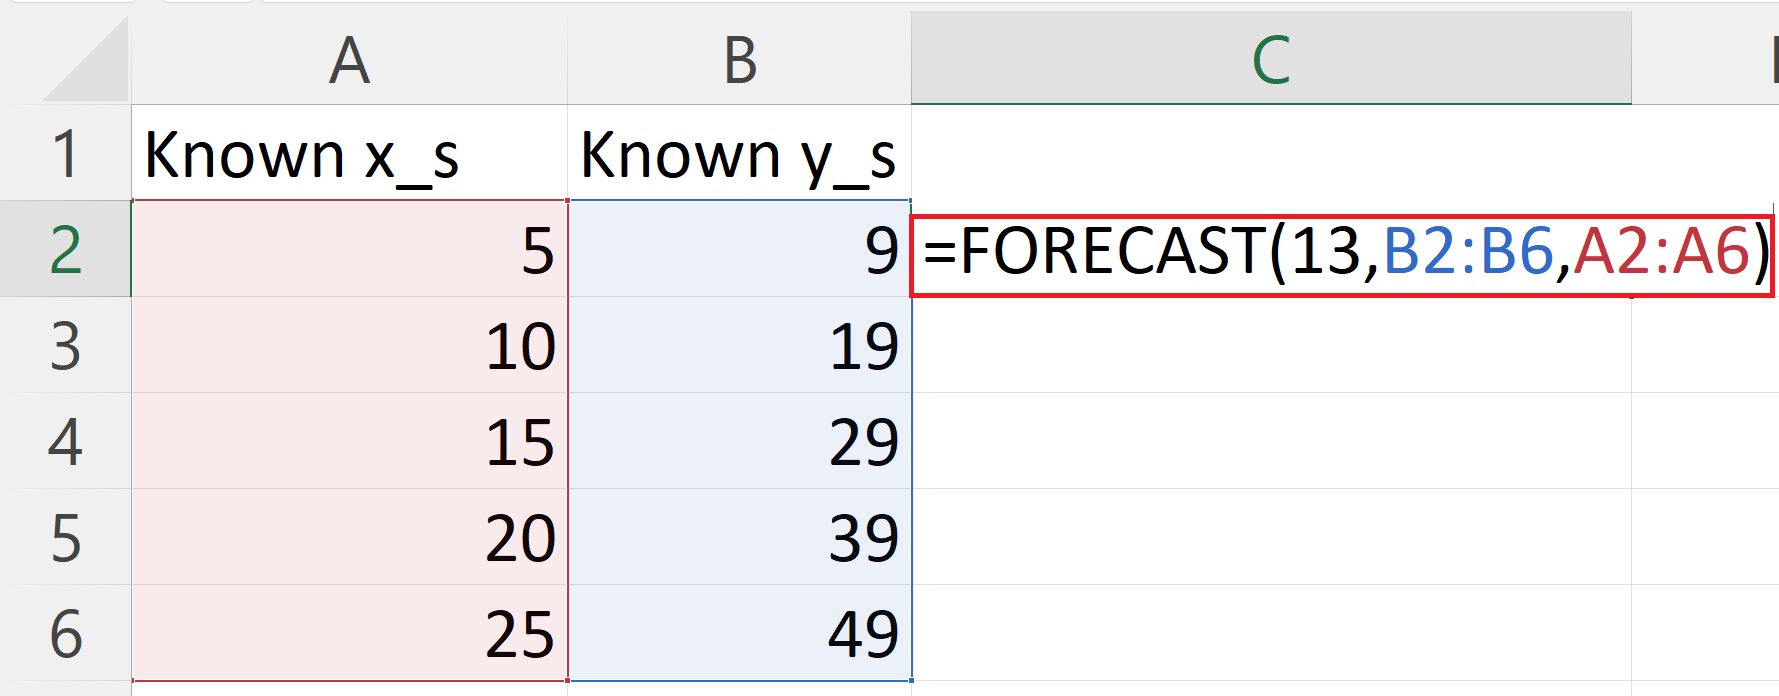
– The syntax for the FORECAST function will be:
FORECAST(13,B2:B6,A2:A6)
– Where the first argument i.e. 13 is the value of the independent variable for which you want to calculate the value of the dependent variable.
– The second argument is.e. B2:B6 is the range of cells containing values of known dependent variables.
– The third argument i.e.A2:A6 is the range of the cells containing the values of known independent variables.
Step 4 – Press the Enter Key
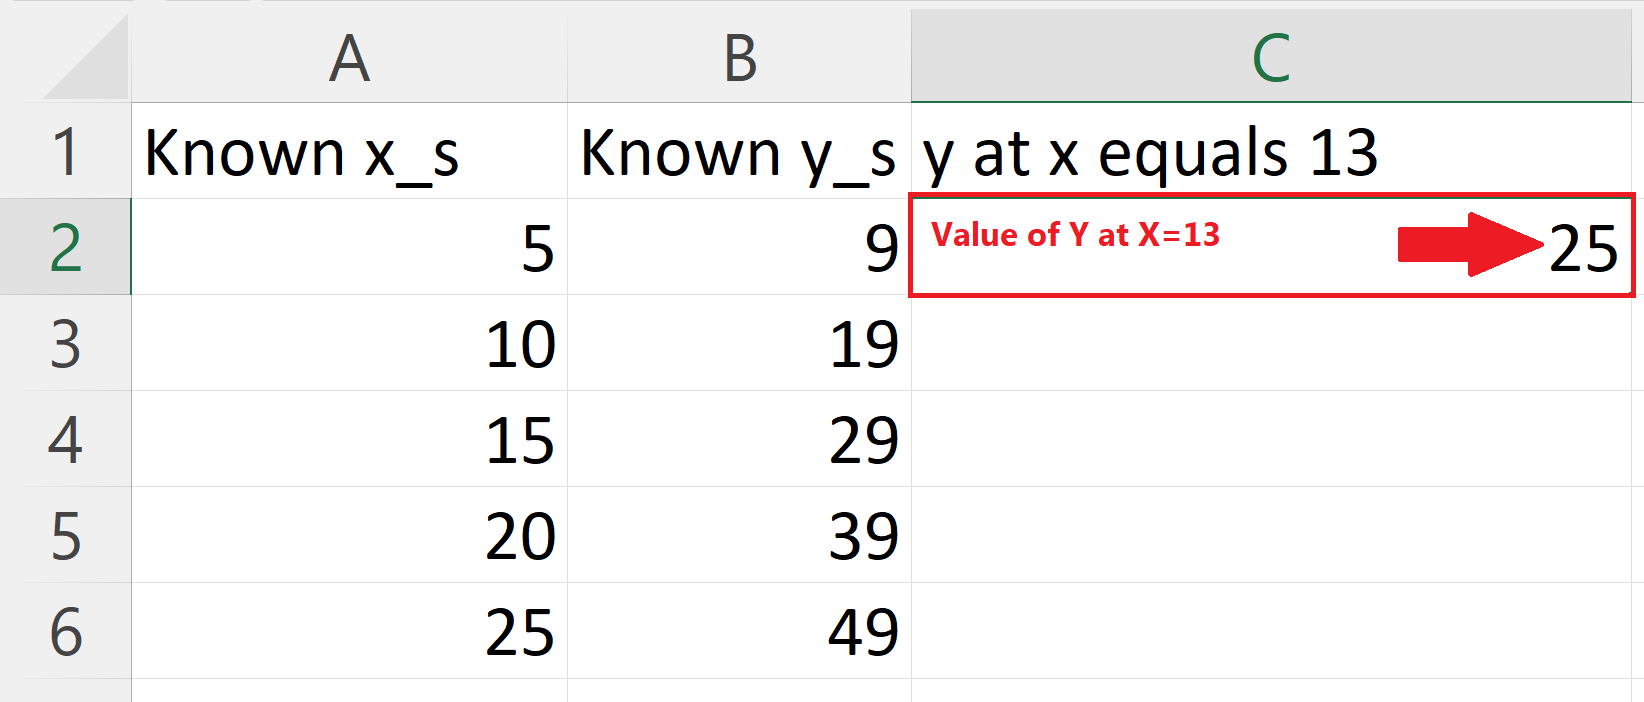
– Press the Enter key to get the results.


