
How To Mark A Point On A Graph In Excel
 By
SpreadCheaters
By
SpreadCheaters
Graphs and charts are powerful tools for visualizing and communicating data, but sometimes it’s important to highlight a specific data point or trend. In Microsoft Excel, you can easily mark a point on a graph to draw attention to a particular value or to label an outlier. Whether you’re creating a presentation, a report, or just exploring your data, adding a marker to a graph can make it more informative and engaging.
In this article, we’ll walk through the steps for marking a point on a graph in Excel, with examples and tips to help you customize your graphs to meet your needs.
We will learn how to mark a point on a graph by using the following dataset.

Method 1 – Add Data Point Marker
Step 1 – Insert Graph
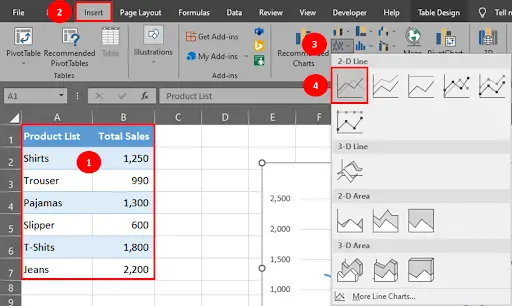
- Select your data, go to Insert Tab, under the Charts group click on the Insert Line or Area Chart button & select Line chart.
- A line chart will be inserted on the sheet.
Step 2 – Customize Your Graph
- To customize the graph, you can click on the chart area and use the Chart Design, Chart Layout, and Chart Format tabs in the top toolbar.
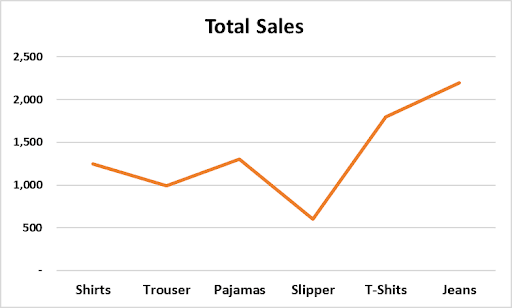
- Your graph should look like this.
Step 3 – Add Data Label
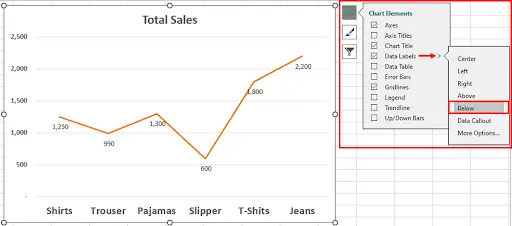
- Click anywhere on the graph, the chart element button will appear on your screen.
- Check Data Labels & select Below option.
- Data Labels will be inserted into your graph.
Step 4 – Select Data Point
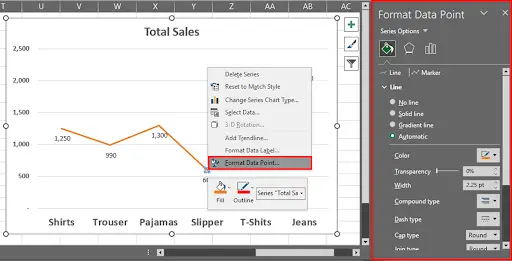
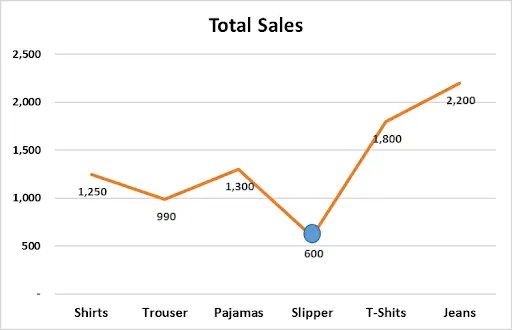
- Suppose we want to mark a data point on slipper sales on the graph.
- To do this, right click on the data point & select Format Data Point.
- Format Data Point Side panel will appear on your screen.
Step 5 – Add Markers
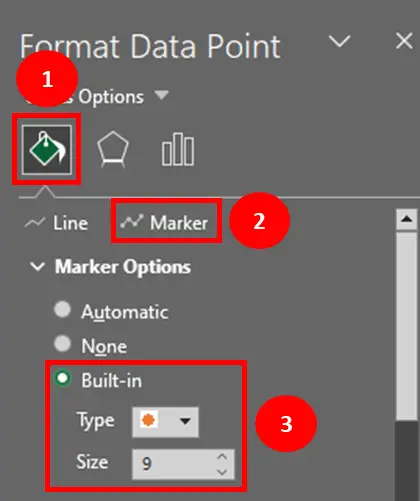
- At the Format Data Point side panel, under Fill & Line option click on the Marker panel. You will see Marker options.
- Choose the Built-in option, select type of marker from drop down list & size as per your requirement.
Step 6 – Data Point On A Graph Marked
- By following these simple steps you can mark a point on the graph.
Method 2 – Add A Shape
Follow step 1, 2 & 3 of the above method to create, customise & add labels to your graph.
Step 4 – Go To Insert Tab
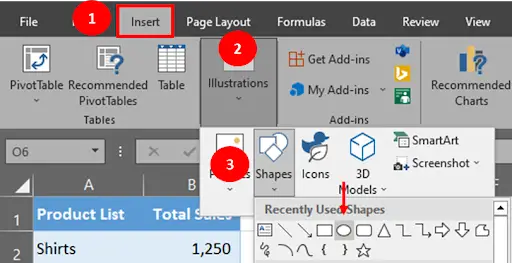
- Go to Insert Tab under Illustrations group go to shapes & select oval shape (you can select any other shape of your choice).
Step 5 – Draw The Shape
- Drag your mouse to draw the shape & place it on your graph. You can format the shape from the Shape Format tab at the top.
Step 6 – Data Point Marked On The Graph
- This is one of the many ways of marking a data point on your graph.


