
How to make a graph in Excel with multiple lines
 By
SpreadCheaters
By
SpreadCheaters
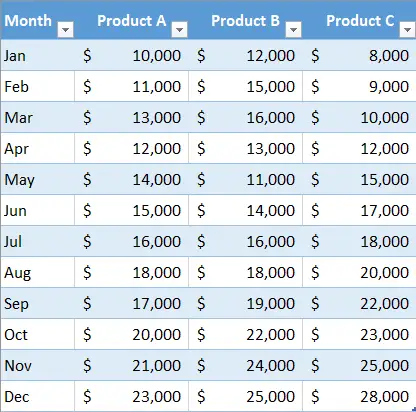
In this tutorial, we’ll learn how to plot multiple lines on the same graph in Excel. Let’s start with an example dataset above.
Suppose we have a dataset that tracks the monthly revenue of three different products (Product A, Product B, and Product C) over the course of a year.

Microsoft Excel is an effective data management and visualization application that can be used to store, examine, and produce reports on enormous amounts of data. It can be used to plot various graph types, including line graphs, bar graphs, and others. The line graph is also known as a line plot or a line chart. In this, graph lines are used to connect individual data points. It displays quantitative values over a specified time interval. Line charts are particularly useful for showing trends that occur gradually over time, and for identifying patterns or irregularities in the data that may be difficult to see in other types of charts.
Step 1 – Select Data
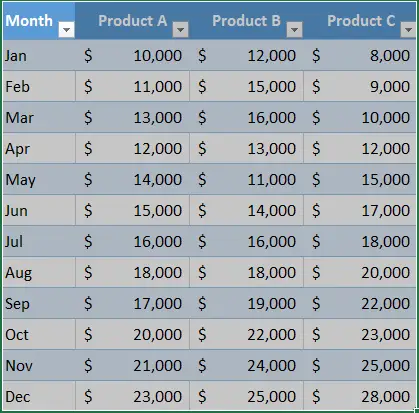
– With the help of a selection handle, select your data.
Step 2 – Go To Insert Tab
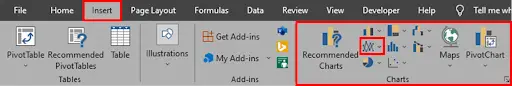
– Go to the insert tab & select “Line” from the “Charts” section of the ribbon.
Step 3 – Select The Chart Type
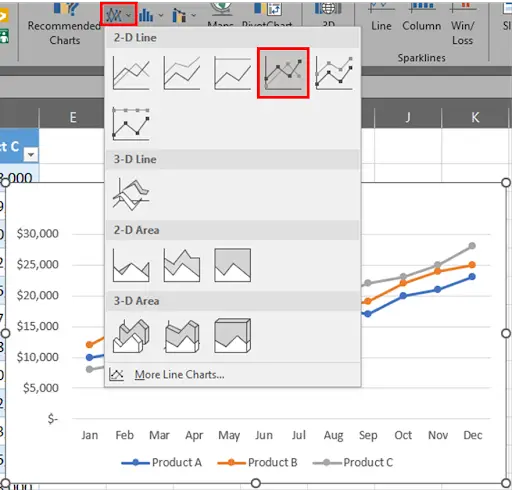
– Choose the type of line chart you want to use from the dropdown menu. For this example, let’s use the “2D Line” chart with markers.
Step 4 – Create the Line Chart
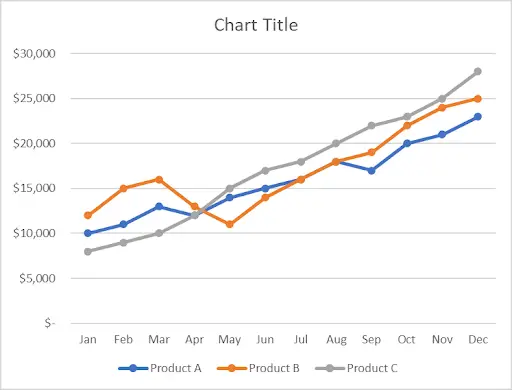
– After clicking on the appropriate action button, Excel will automatically create a basic line chart using your selected data, showing the sales of all three products over the year. However, the chart may be difficult to read and you may want to make some adjustments to it.
Step 5 – Make Adjustments to the Line Chart
– You can make adjustments to your chart by clicking on the “chart design” tab.
– Depending on your requirement change layout, style & colour under sub sections of chart design tab.
– Change chart title & resize chart area if required.
– Rearrange Legends & Data Labels.
– You can either save the chart as a separate file or copy and paste it into another document when you are satisfied with its appearance as shown below.


