
How to hide field buttons in Pivot Charts.
 By
SpreadCheaters
By
SpreadCheaters
When working with a Pivot Chart, the field buttons provide users with the ability to filter, sort, or modify the data displayed in the chart. However, there may be situations where you want to hide these field buttons to present a cleaner or more streamlined view of the chart. Hiding field buttons can be useful when you want to focus the audience’s attention on the chart itself rather than the underlying data manipulation options. By hiding the field buttons, you can create a more polished and professional look for your pivot chart. This can be particularly beneficial when sharing the chart in presentations, reports, or dashboards.
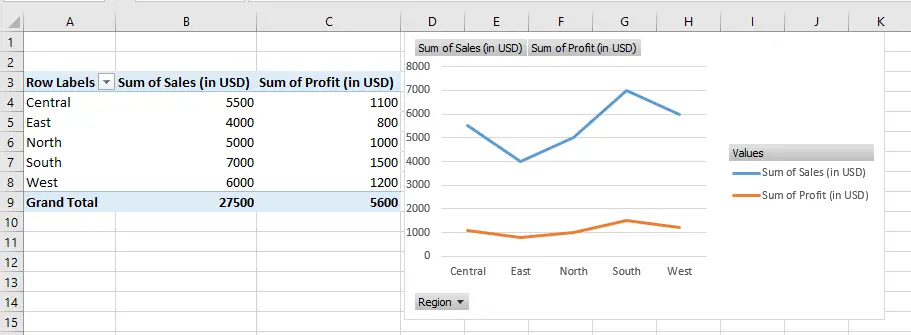
The “Sales Performance” dataset provides a snapshot of sales and profit figures across different regions for a company. It includes information on the total sales amount in USD and the corresponding profit generated in each region. This dataset allows analysis of the financial performance of each region, aiding in decision-making regarding resource allocation, expansion strategies, and growth opportunities.
Method – 1 Use the Field button
We can use the Analyze Tab options to show or hide the Field buttons of a pivot chart, as explained below.
Step – 1 Go to Field Buttons
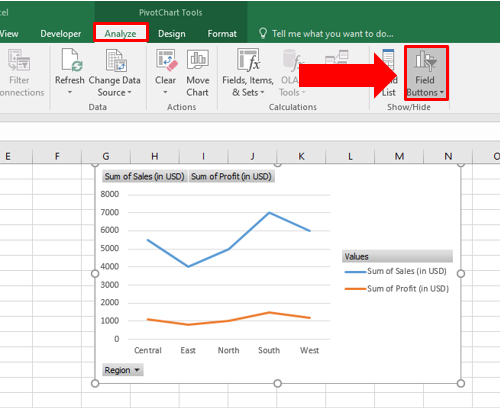
- Click on the pivot graph, Analyze tab will appear on ribbon.
- Go to Analyze tab, in the show/hide tab click on field Buttons all field buttons will be shown in selected Pivot Chart.
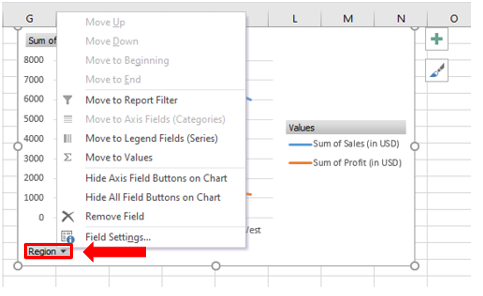
Step – 2 Hide/Unhide Field buttons
- To hide/show a kind of field buttons, such as Axis Field buttons, click the arrow at the bottom-right corner of Field Button.
- Then uncheck/check the Axis Field Button from the drop down list.
Method – 2 Hiding a field button’s context menu
A second option to hide the field buttons is also available on the pivot chart itself. You can use the button’s context menu to Hide the field button as explained in below steps.
Step – 1 Select the field
- Right-click on the field button that you want to hide
- A dialogue box will appear.
Step – 2 Hide the field
- Click “Hide Value Field Buttons on Chart” from the drop-down list to hide the field button;
- If you want to hide all field buttons in the pivot chart, click “Hide All Field Buttons on Chart“.
Conclusion:
Hiding field buttons in a pivot chart can be important for several reasons. Firstly, it allows for a cleaner and more streamlined visual presentation of the chart, removing distractions and focusing the audience’s attention on the data itself. By eliminating the field buttons, the chart appears more polished and professional, which can be beneficial when sharing it in presentations, reports, or dashboards. Additionally, hiding the field buttons can help prevent accidental modifications to the chart by users who might not be familiar with pivot table functionality. It ensures that the chart’s appearance remains consistent and reduces the risk of unintentional changes to the data or its visual representation.


