
How to graph an equation in excel
 By
SpreadCheaters
By
SpreadCheaters
Page last updated:
11/10/2022 |
Next review date:
11/10/2024
If you want to graph an equation Excel offers a very powerful graph feature that allows you to display the relation between two variables. To graph an equation in Excel proceed as follows.
Step 1 – Select the data
– Select the X values;
– Select the equation results.
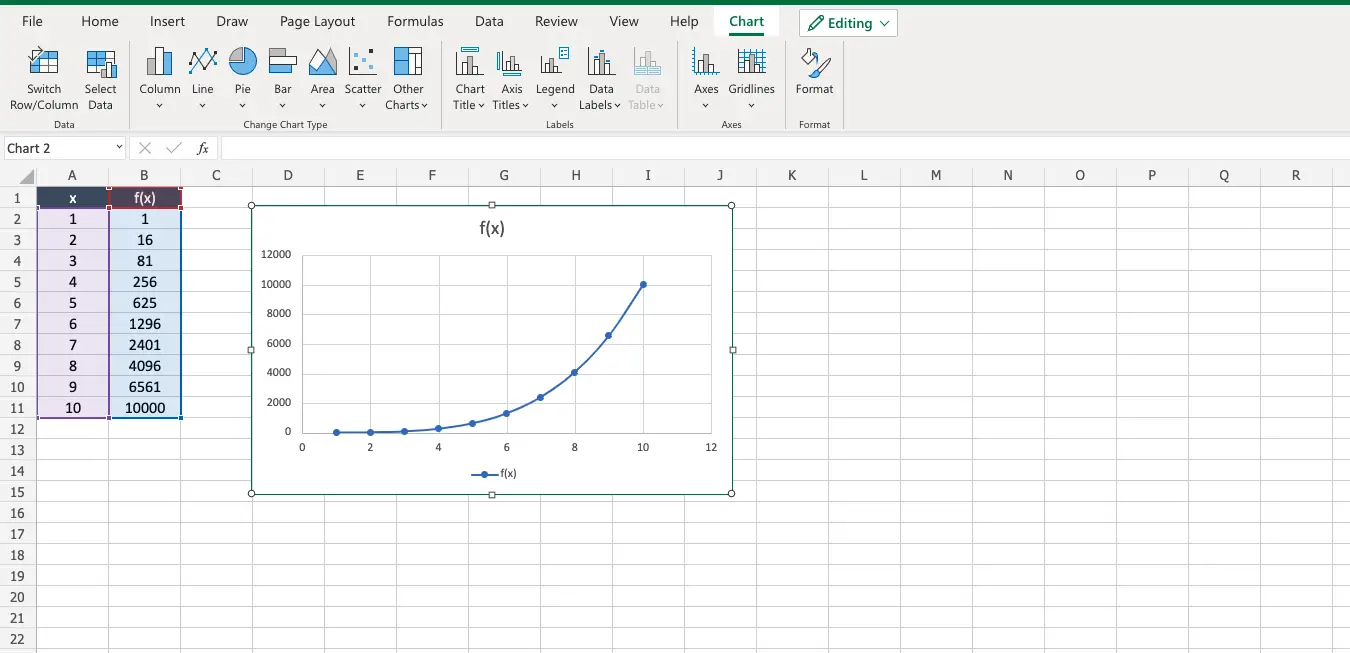
Step 2 – Add the Graph
– Navigate to the “insert” tab;
– Locate the “charts” area;
– Click on “scatter” to open the dialog menu with all the type of available graphs;
– Click on “scatter with smooth lines and markers” to add the graph.


