
How to get descriptive statistics in Excel
 By
SpreadCheaters
By
SpreadCheaters
You can watch a video tutorial here.
In statistical analysis, you will frequently need to summarize the data that you are studying. This includes finding out metrics such as the mean, median, and mode that gives you an idea of the nature of the data. Excel has a tool that provides a list of these metrics. It is accessible through the Data Analysis tool.
Note: If the Data Analysis button is on the Data > Analyze ribbon, then skip Steps 1 to 3 below.
Step 1 – Open the Excel Options window
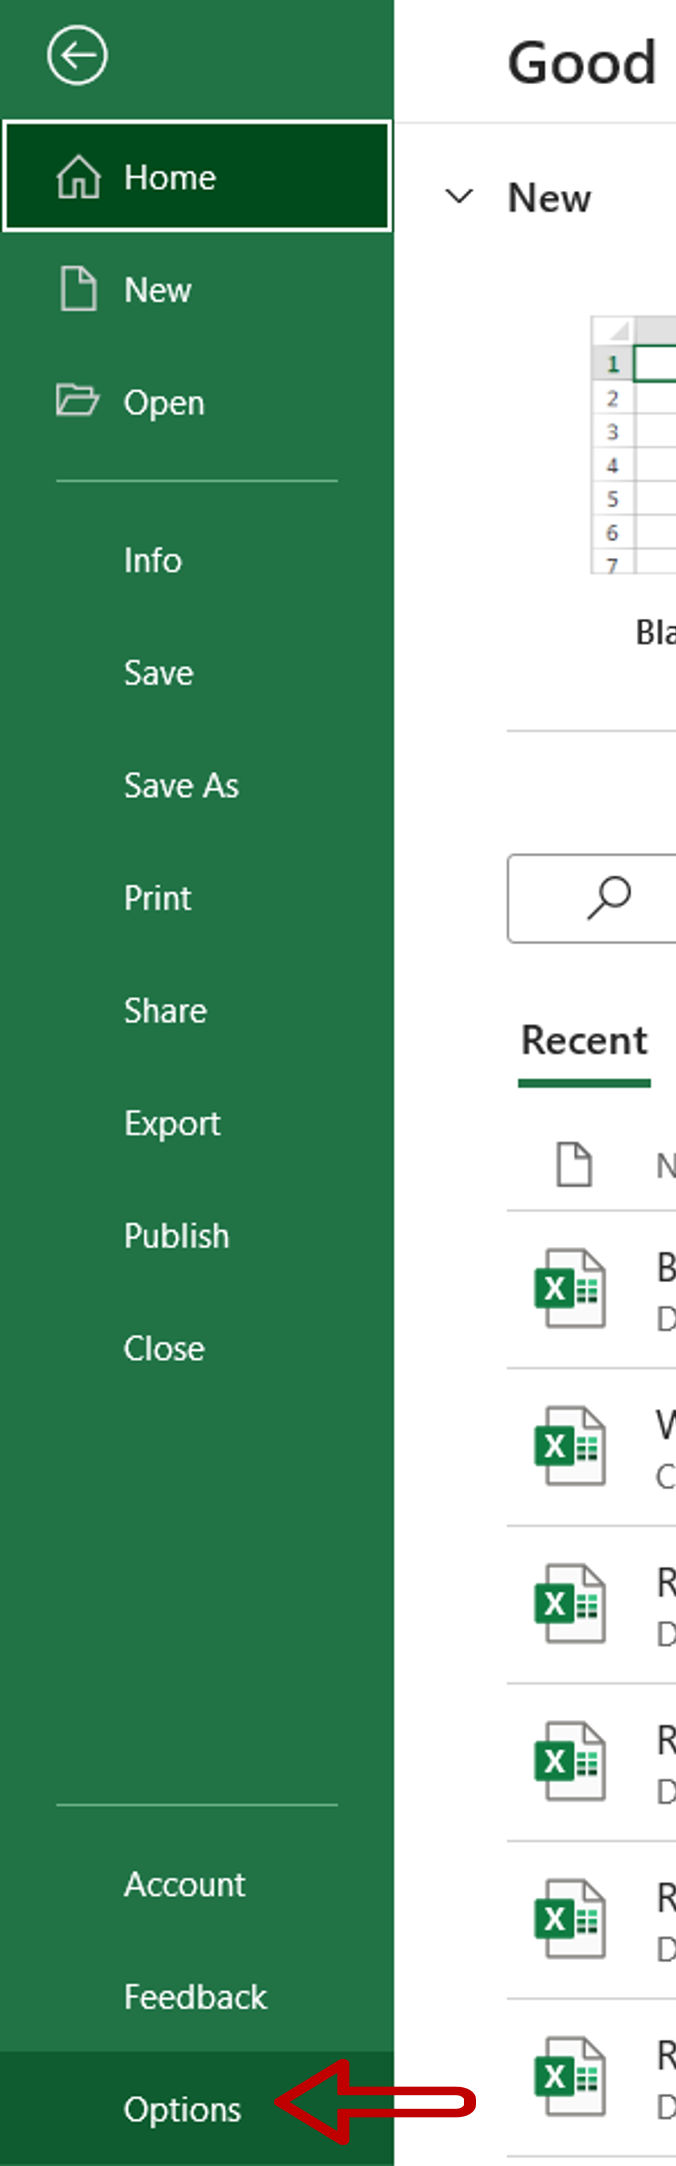
– Go to File > Options
Step 2 – Manage the Add-ins
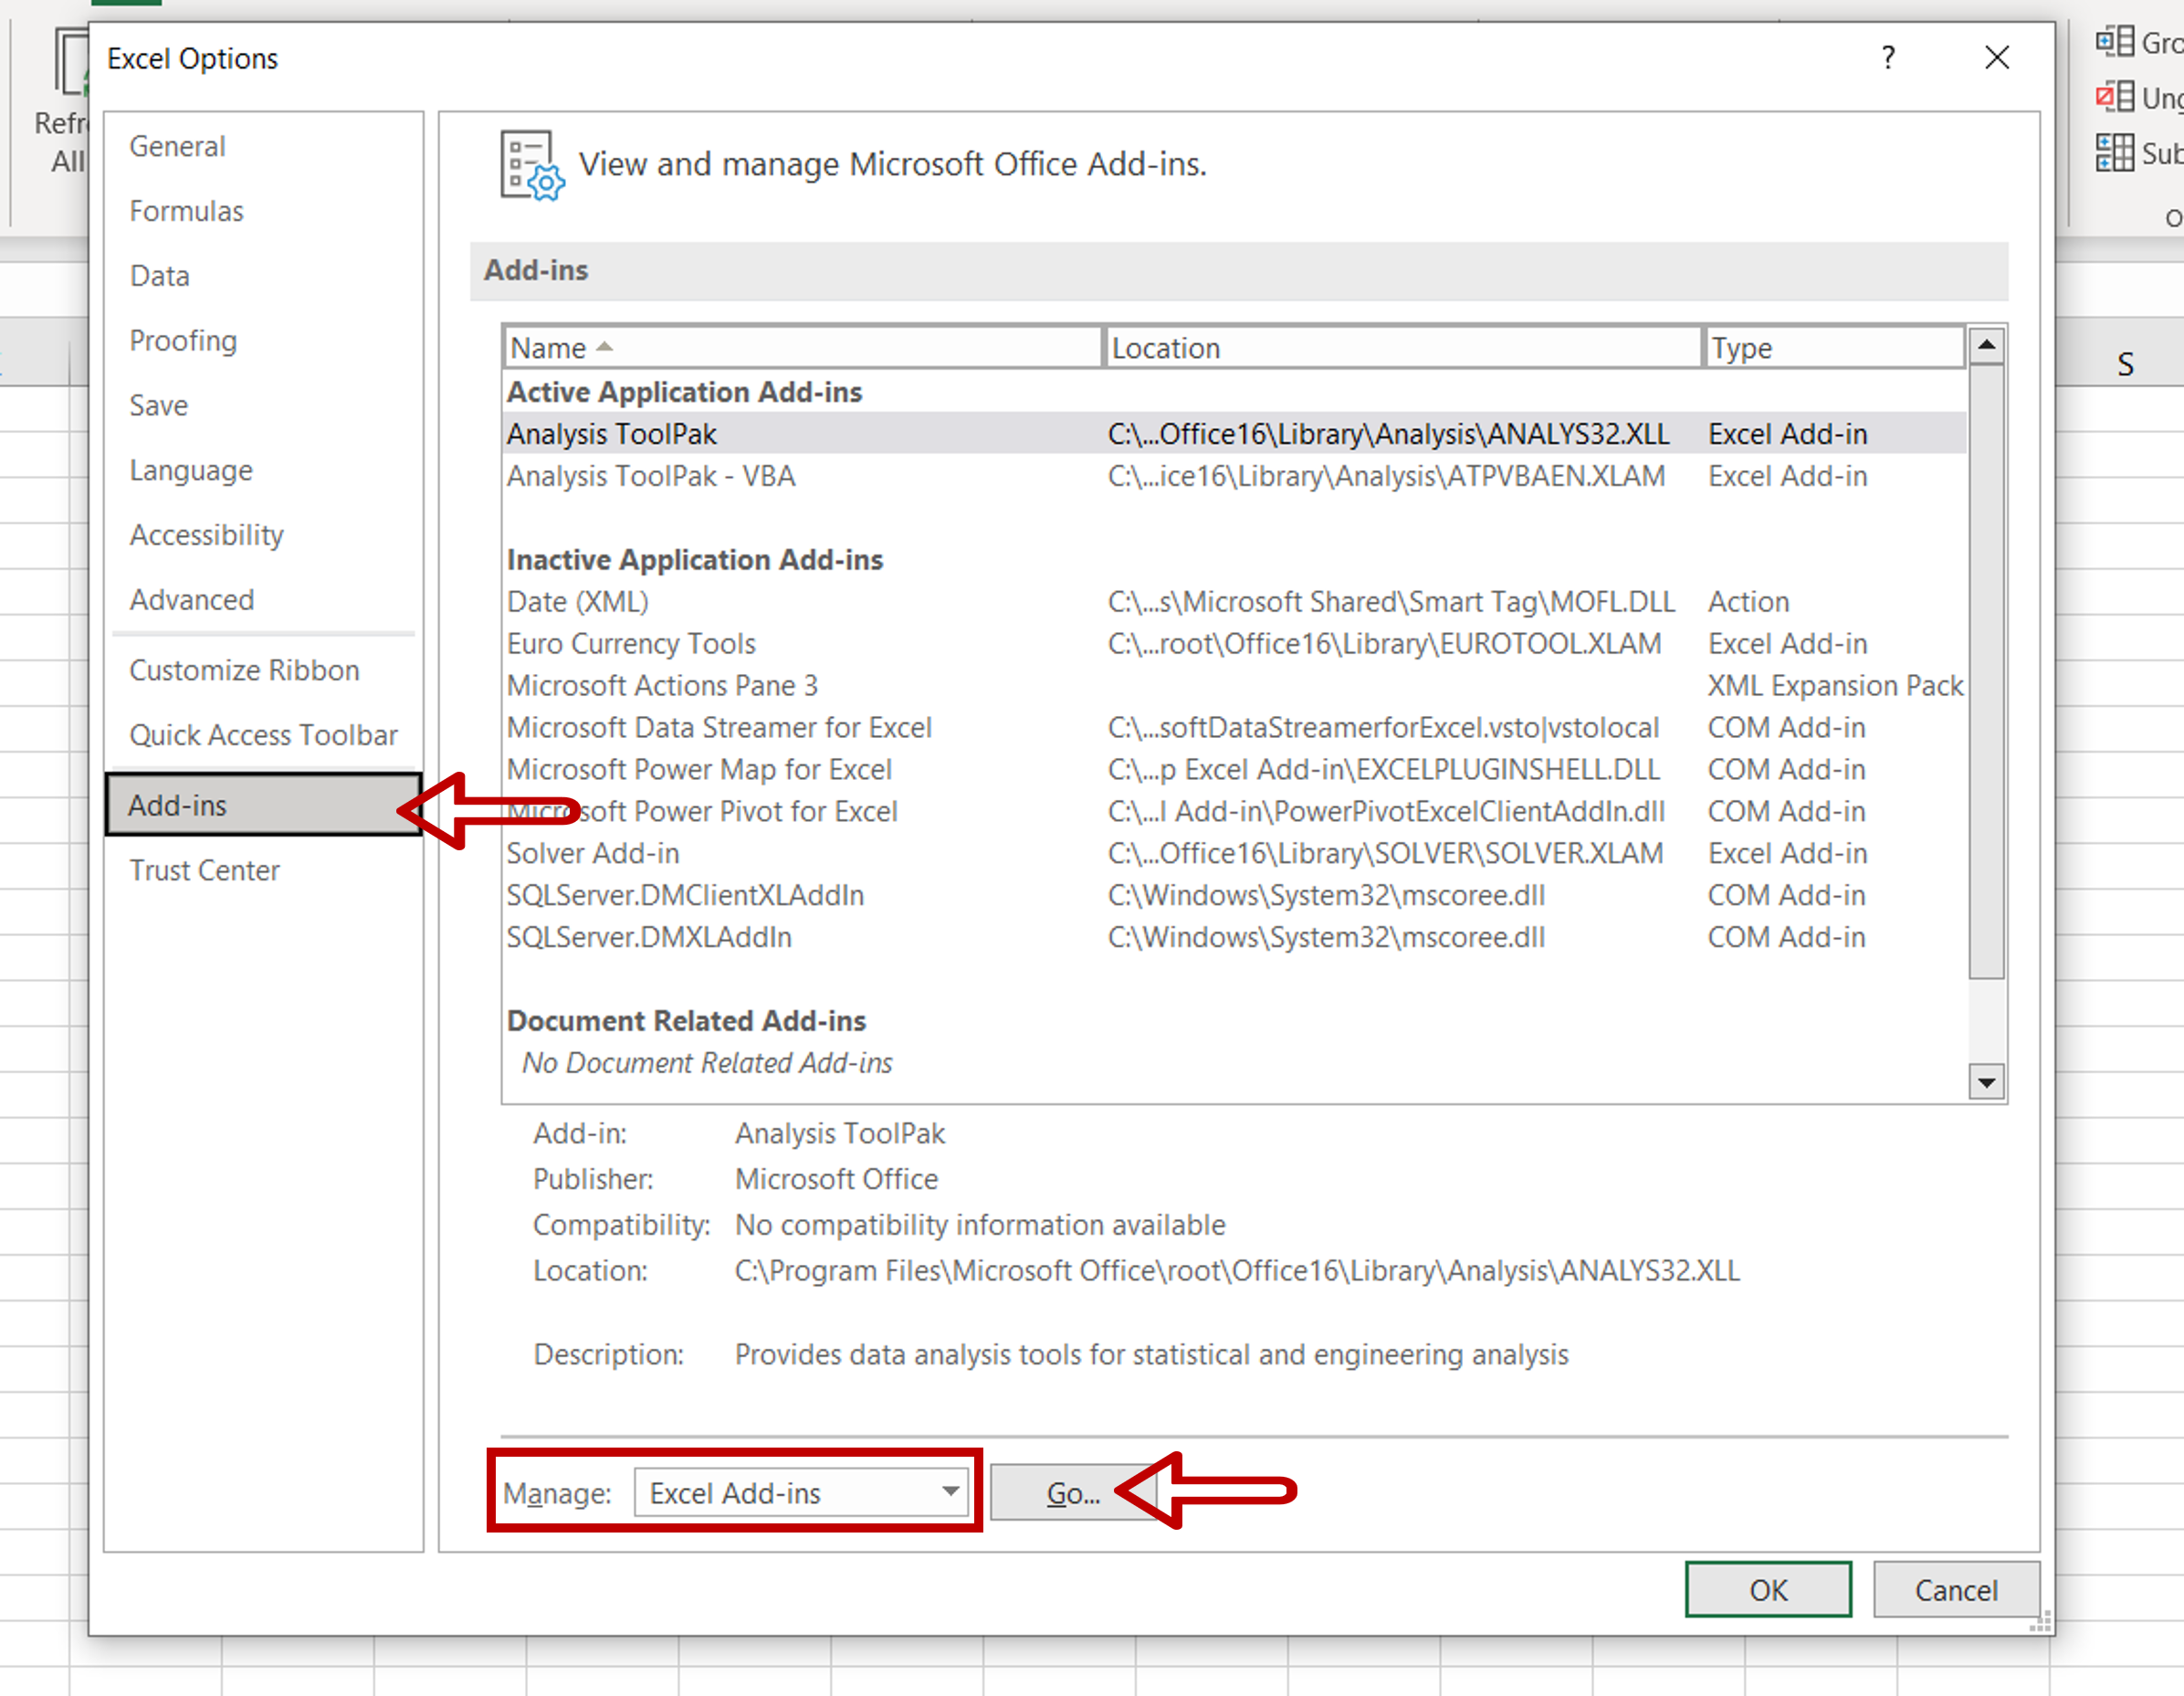
– Go to Add-ins
– Select Excel Add-ins from the Manage drop-down
– Click Go
Step 3 – Load the Analysis ToolPak add-in

– Select Analysis ToolPak
– Click OK
Step 4 – Open the Descriptive Statistics window
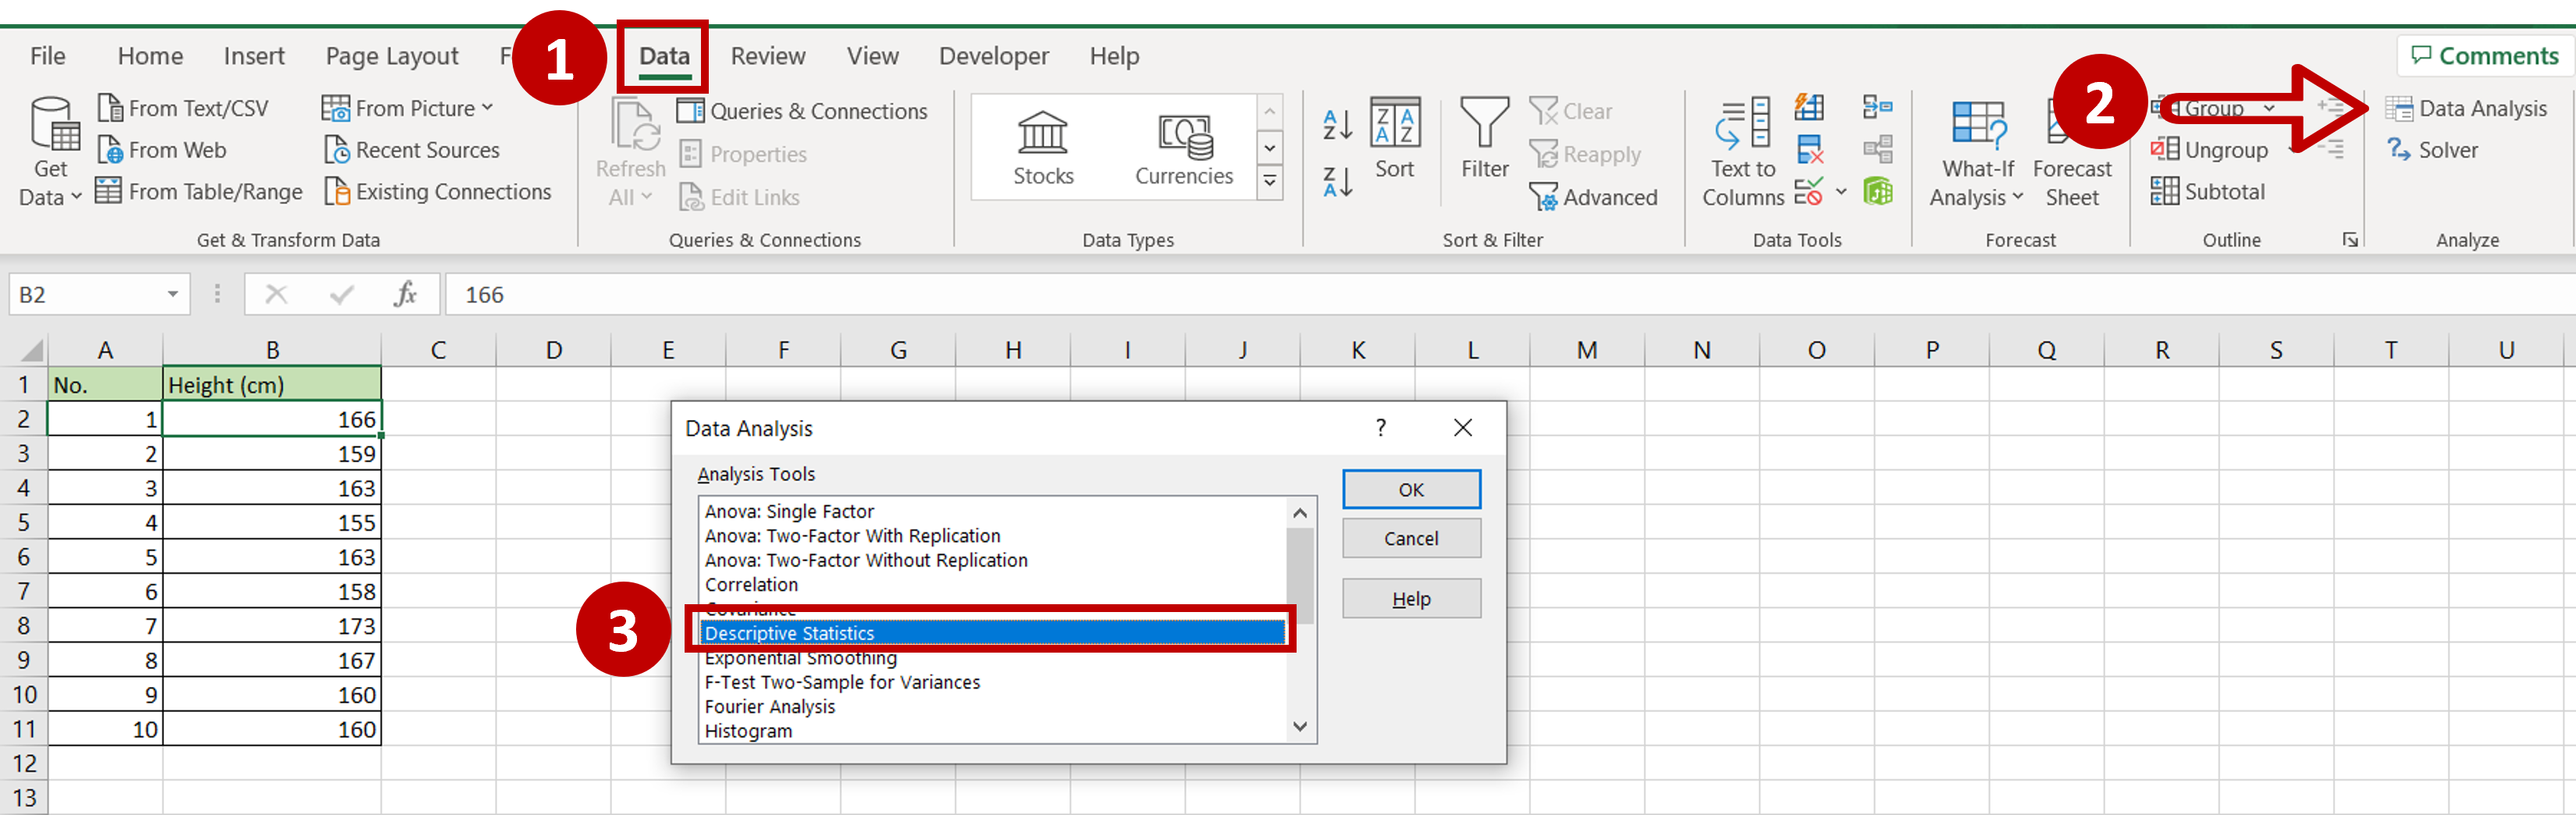
– Go to Data > Analyze
– Click on the Data Analysis button
– In the window, select Descriptive Statistics
– Click OK
Step 5 – Set the parameters
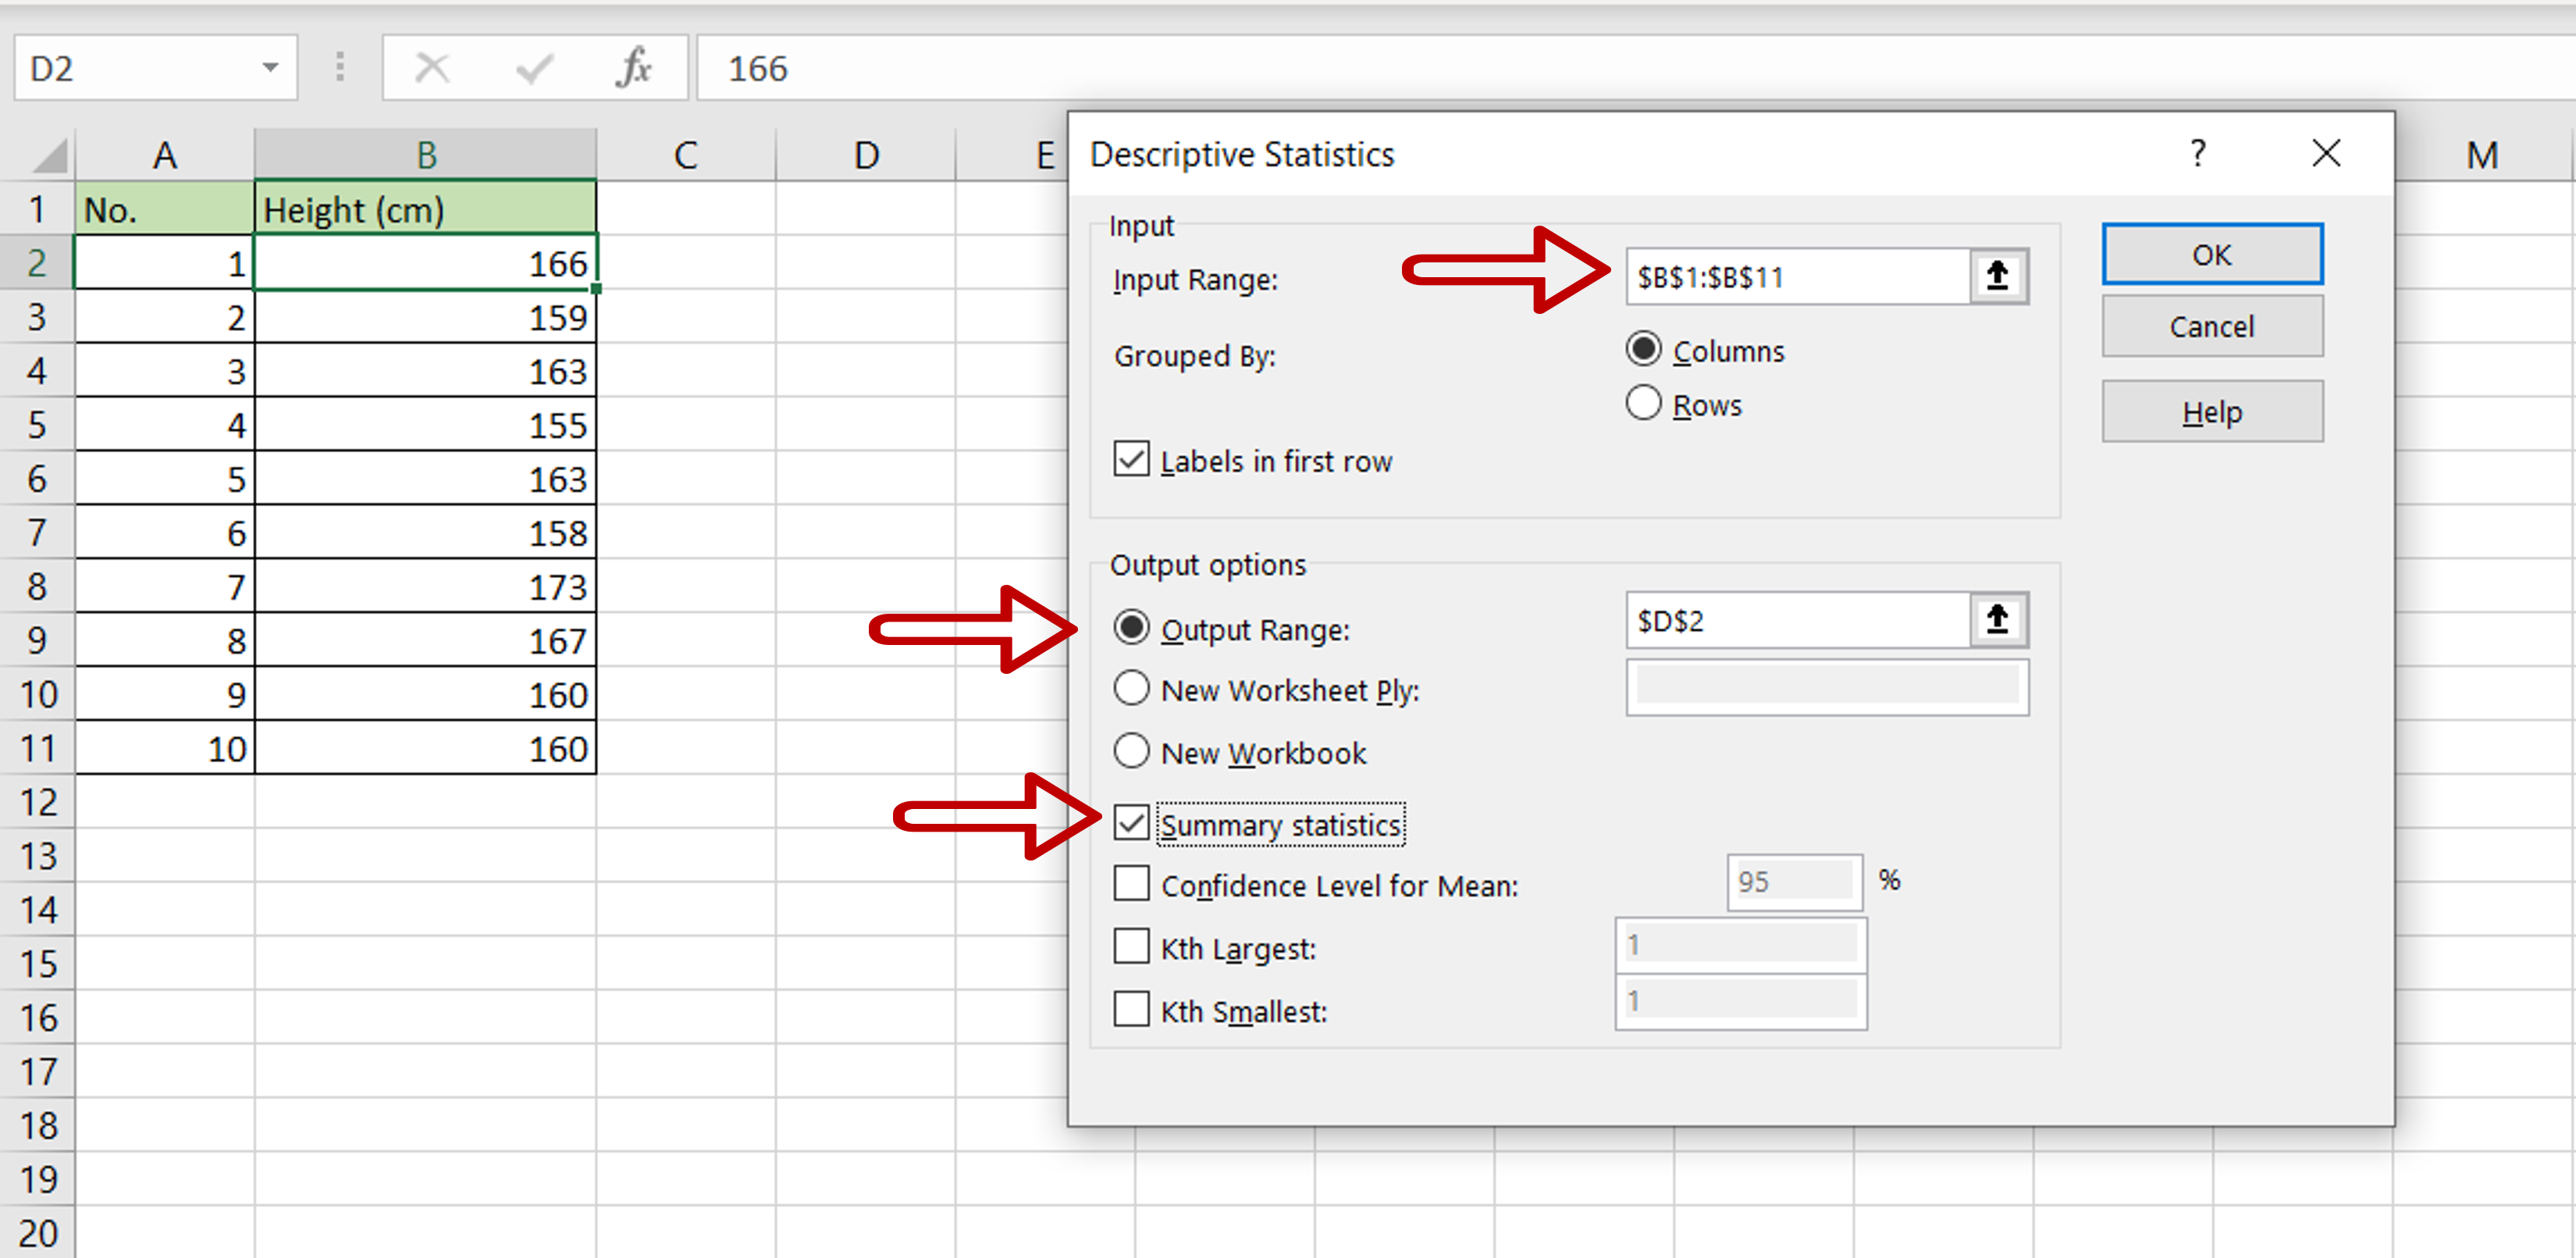
– Define the input range:
>Input Range: the range of the ‘Height (cm)’ column
>Tick Labels in first row
>Output Range: where the result is to be displayed
>Tick Summary Statistics
– Click OK
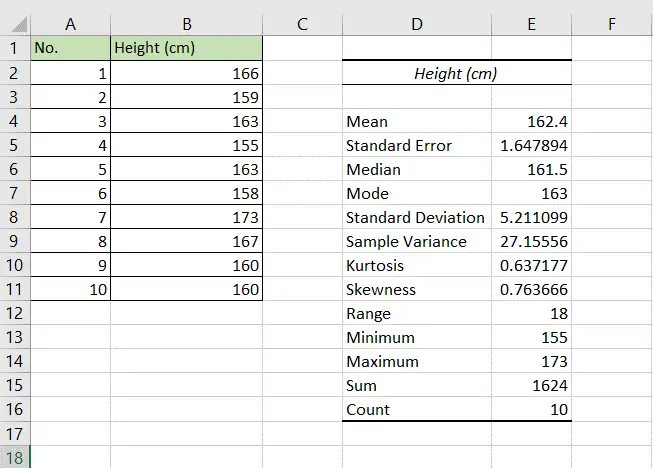
Step 6 – Check the result

– The descriptive statistics are displayed for the dataset


