
How to get a 4th Degree Polynomial in Excel
 By
SpreadCheaters
By
SpreadCheaters
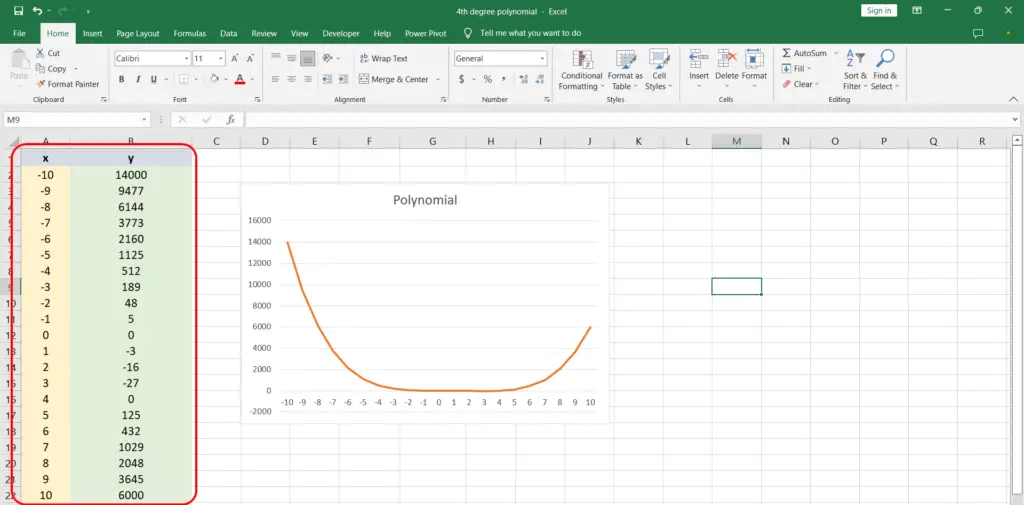
We have a data set with x and y values along with the associated chart as shown and we need to identify its 4th degree polynomial.

Excel provides a very efficient regression tool for curve fitting within the chart elements of a data chart. Let’s find out how to get a 4th degree polynomial for a given data set.
Step 1 – Add the Trendline
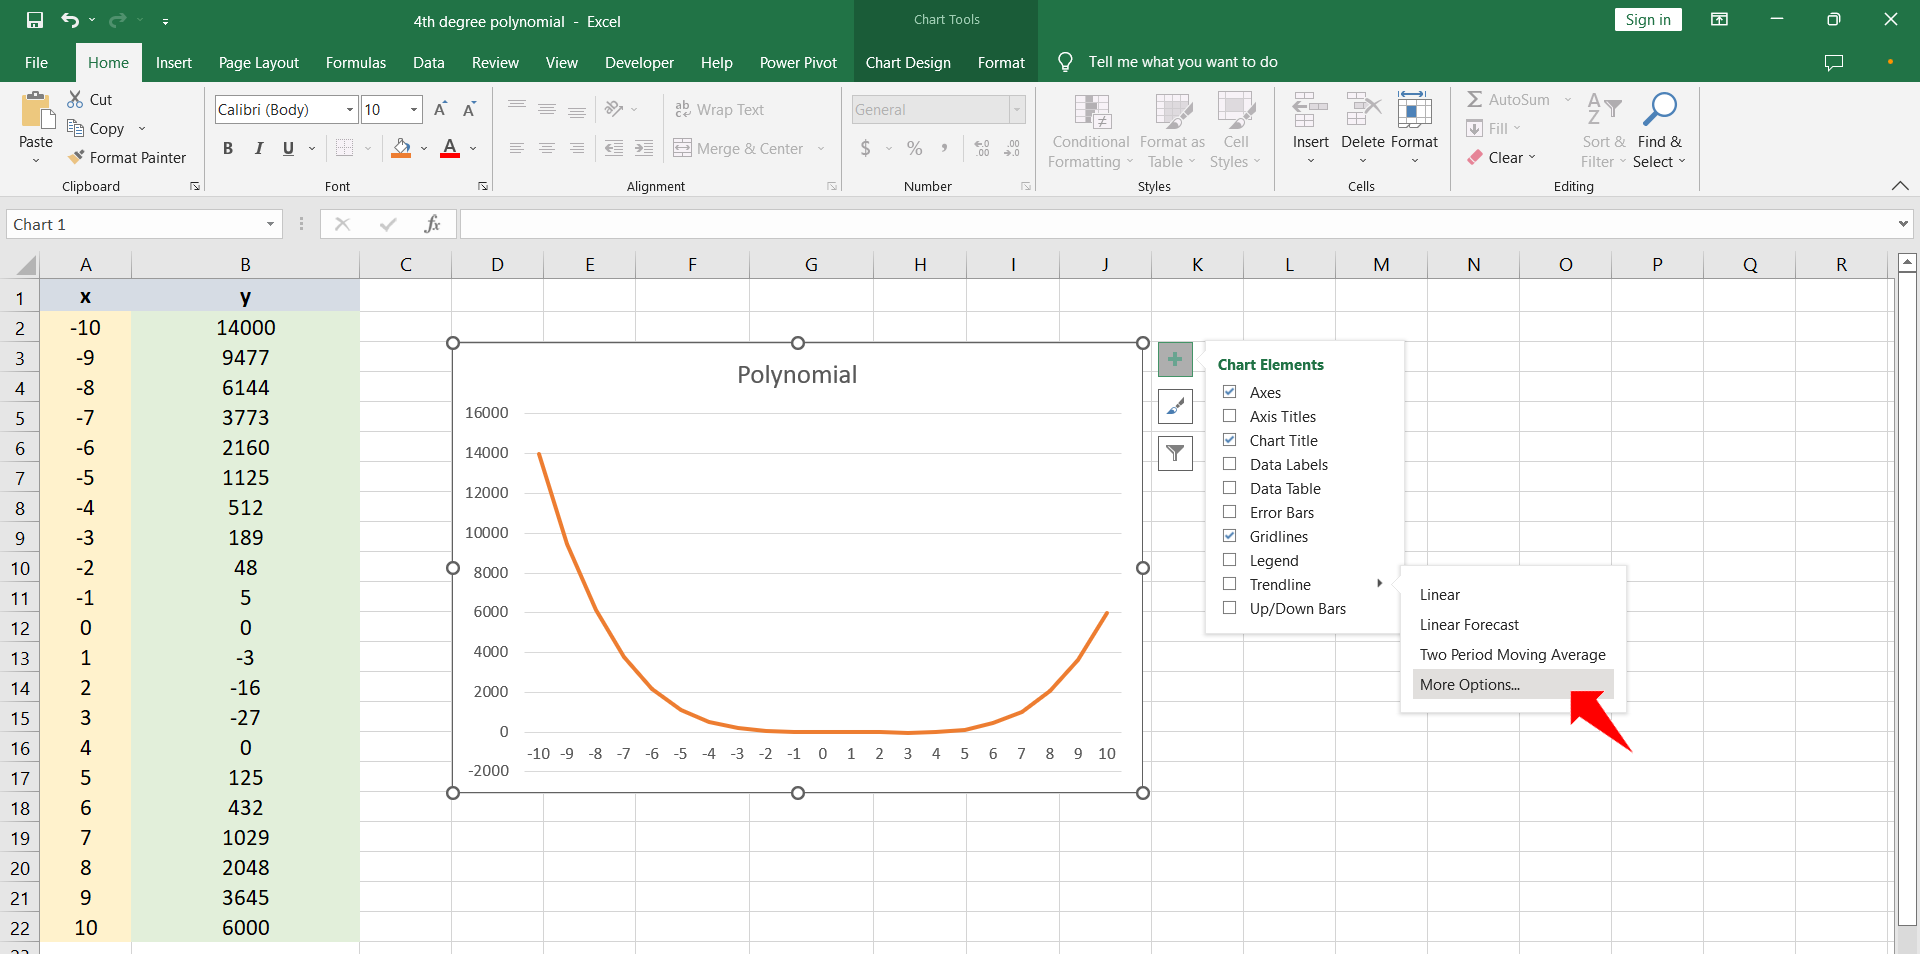
– To identify the governing equation for the given data click the chart.
– Click the plus sign to access Chart Elements.
– Hover on the trendline to reveal the right arrow.
– Click the arrow and select More Options.
– The Format Trendline menu will appear.
Step 2 – Find the required polynomial equation
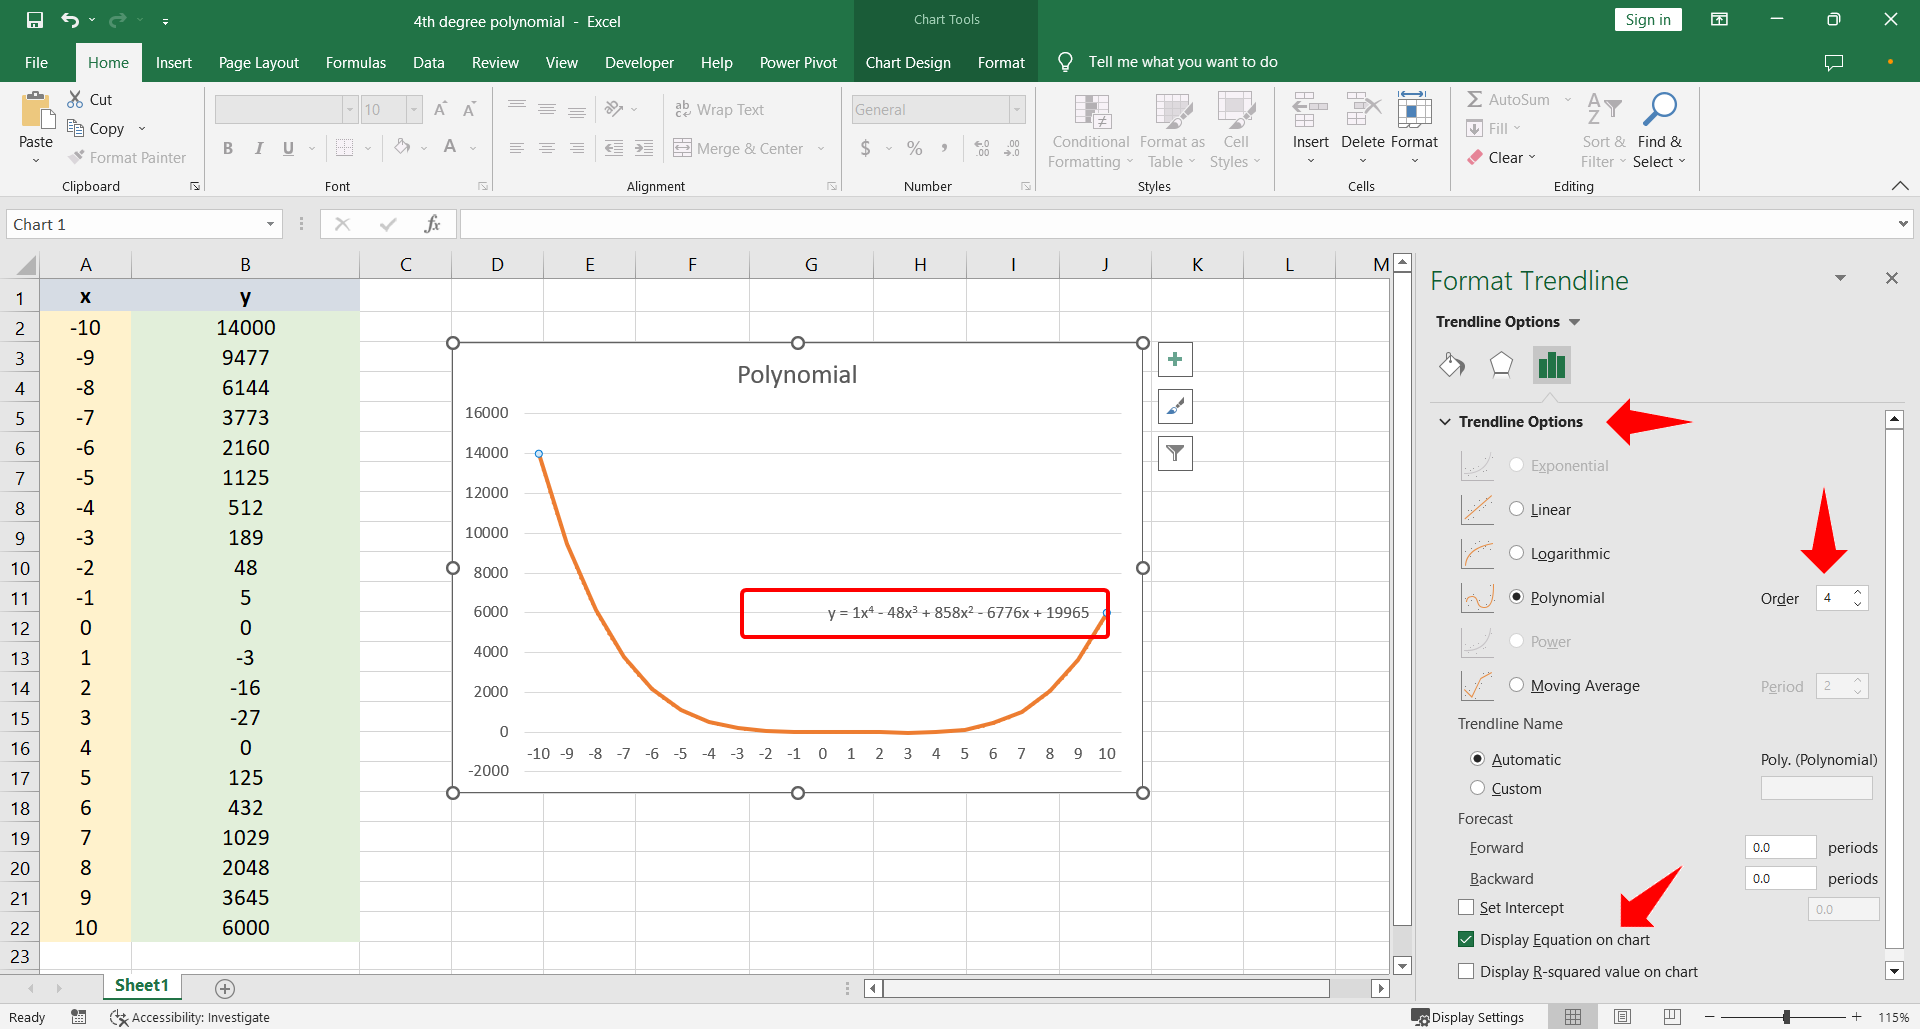
– Under Trendline Options click the Polynomial option and type 4 in the Order textbox.
– Scroll down and select Display Equation on chart to display the equation.
– The 4th degree polynomial can be seen on the chart.


