
How to find the slope in Excel
 By
SpreadCheaters
By
SpreadCheaters
Page last updated:
10/01/2023 |
Next review date:
10/01/2025
You can watch a video tutorial here.
Excel is widely used for mathematical operations due to the variety of functions and tools it provides. When working with Excel, you may need to find the slope of a set of coordinates. There are 3 ways of doing this:
- Create a chart and use the equation on the trendline
- Use the SLOPE() function: this returns the slope of a line
- Syntax: SLOPE(known-y’s, known-x’s)
- known-y’s: the range of the y values
- known-x’s: the range of the x values
- Syntax: SLOPE(known-y’s, known-x’s)
- Use the mathematical formula to calculate the slope (m)
- m = change in y coordinates/change in x coordinates
Option 1 – Use the equation
Step 1 – Insert a chart
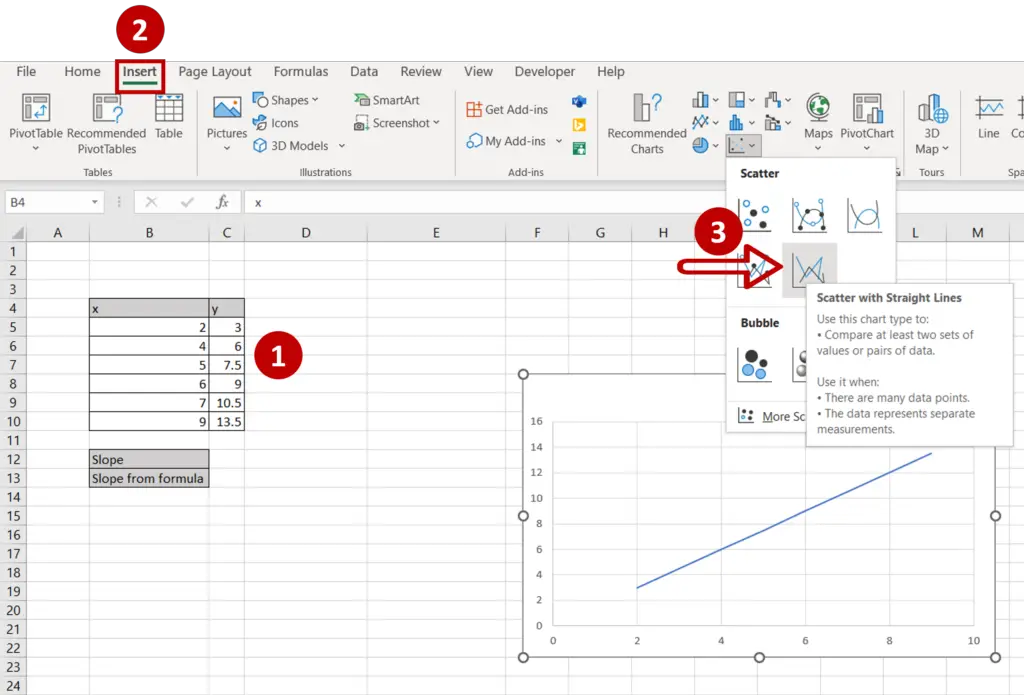
- Select the data
- Go to Insert > Charts
- Expand the Insert Scatter (X,Y) or Bubble Chart dropdown
- Select Scatter with Straight Lines
Step 2 – Open the Format Trendline menu
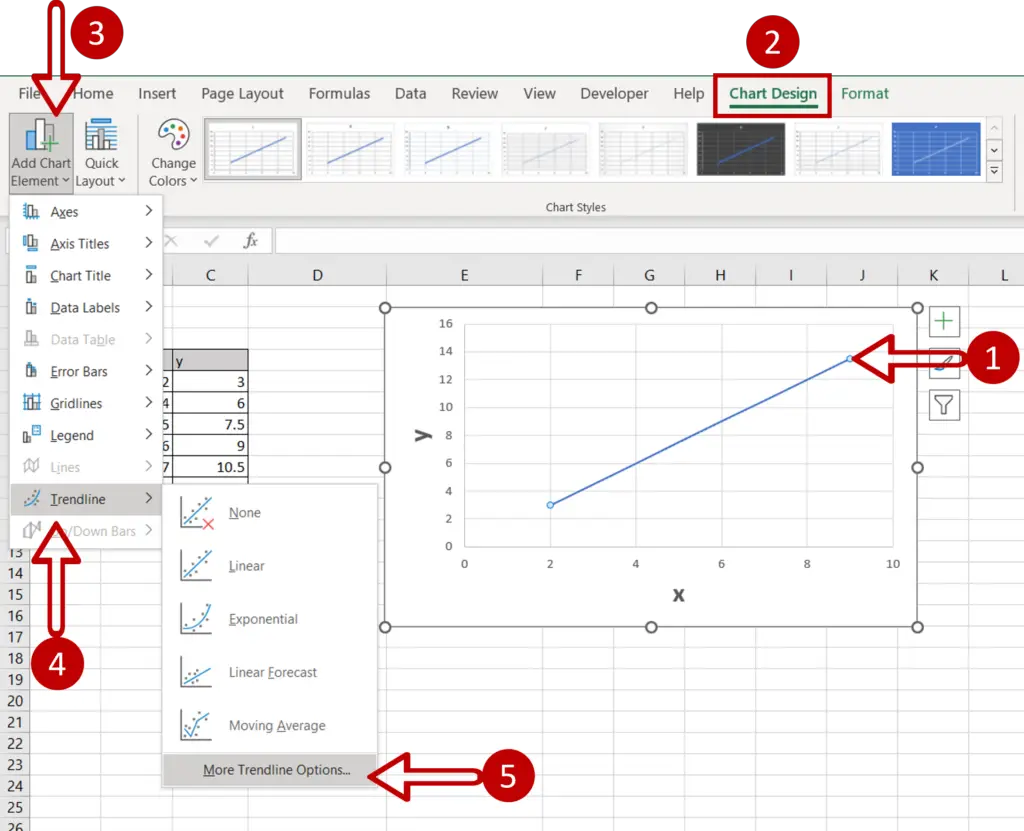
- Select the chart and/or the line
- Go to Chart Design > Add Chart Element > Trendline > More Trendline Options
Step 3 – Select the display option
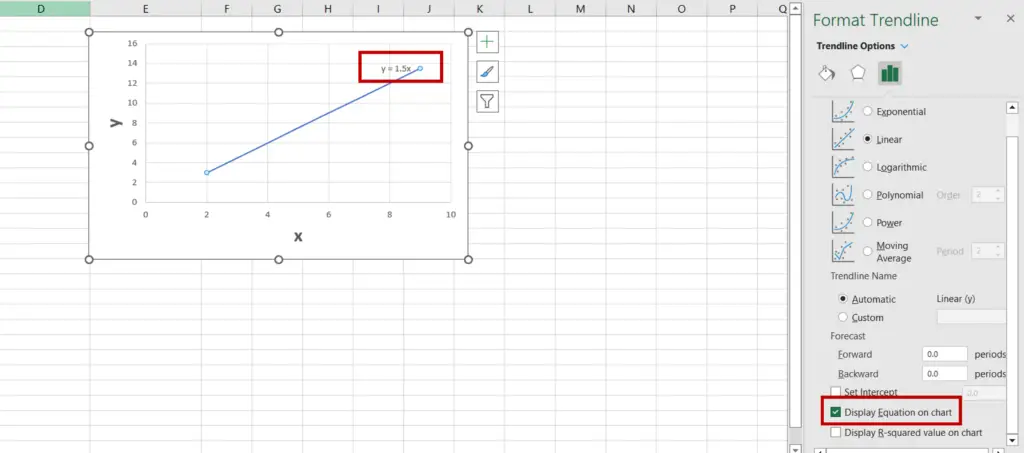
- In the Format Trendline pane, select Display Equation on chart
- The equation will be displayed on the chart
Step 4 – Find the value of the slope
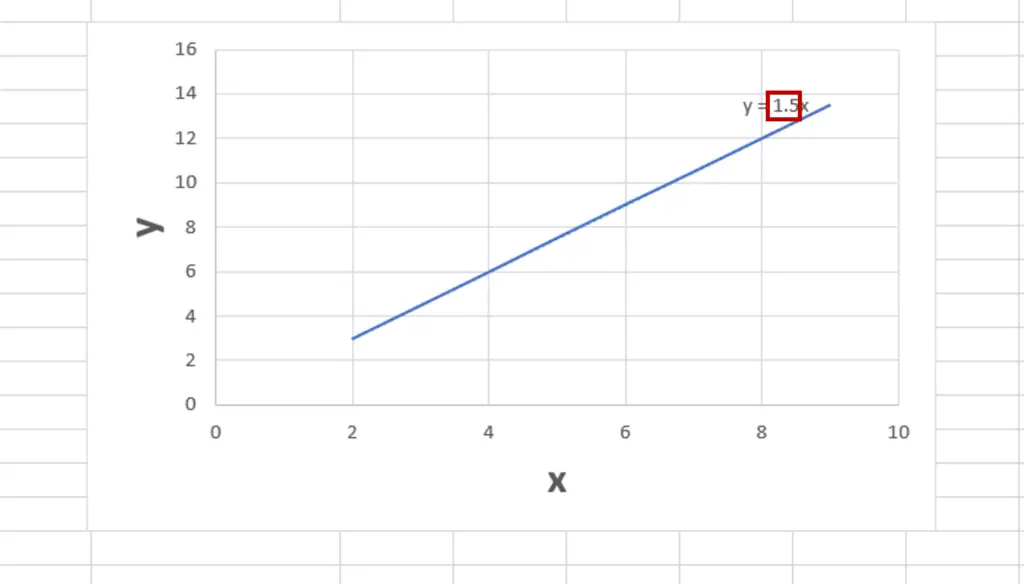
- The slope is the number adjacent to ‘x’
Option 2 – Use the SLOPE function
Step 1 – Create the formula
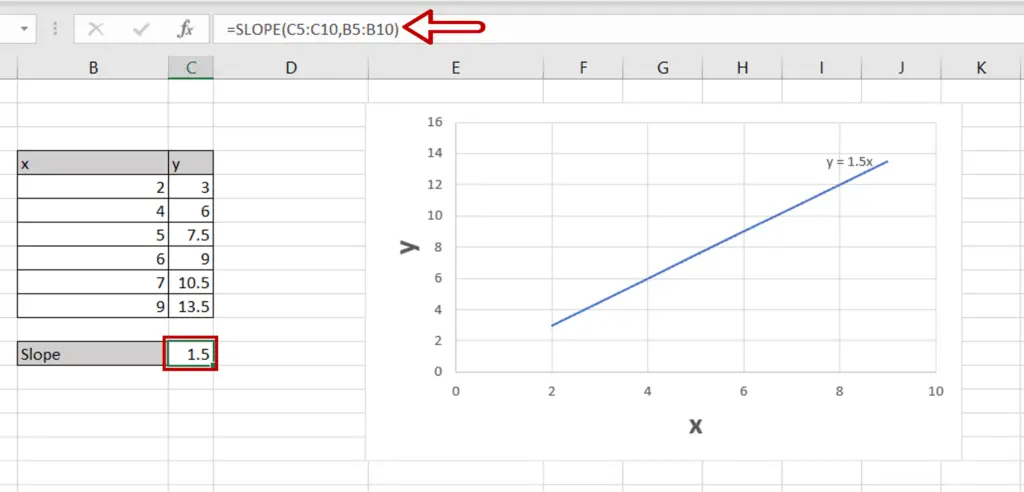
- Select the cell where the result is to be displayed
- Type in the formula using cell references:
=SLOPE(range of y, range of x)
- Press Enter
Step 2 – Check the result
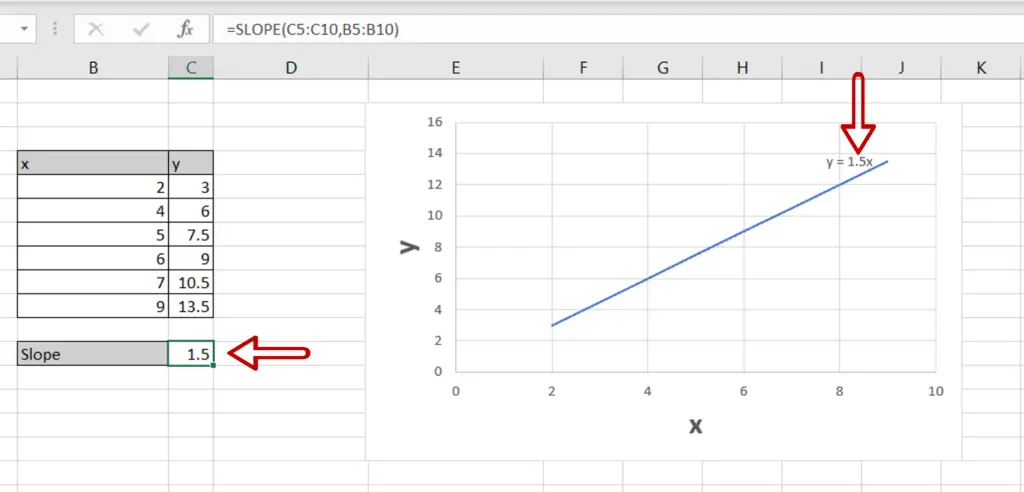
- The value matches that in the equation
Option 3 – Use the SLOPE formula
Step 1 – Create the formula
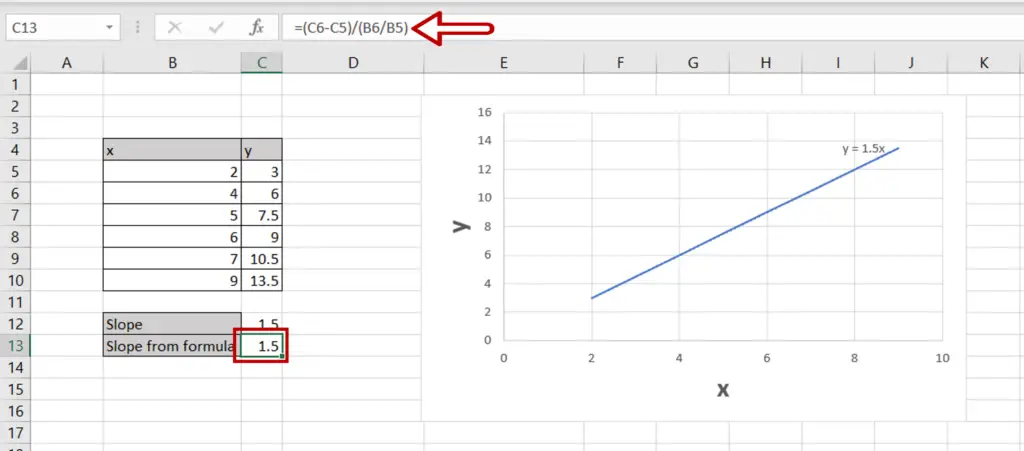
- Select the cell where the result is to be displayed
- Type in the formula using cell references:
=(y2-y1)/(x2-x1)
- Press Enter
Step 2 – Check the result
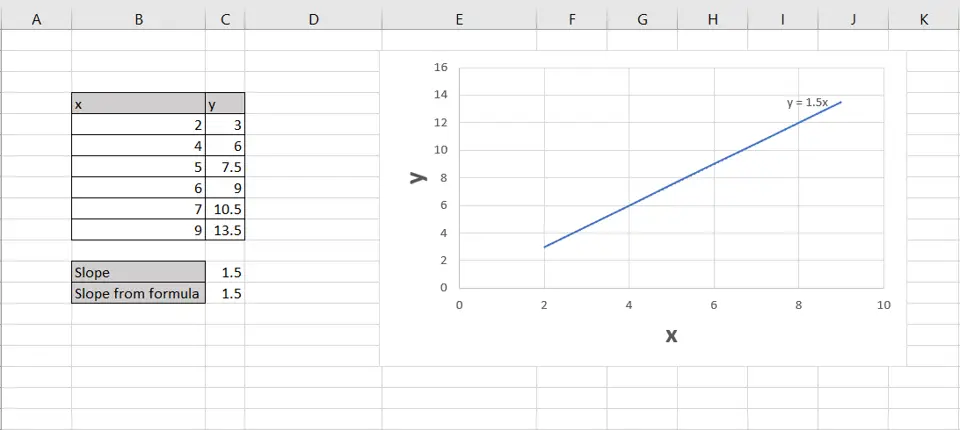
- The value matches that derived from the other 2 options


