
How to find the 95 confidence interval in excel
 By
SpreadCheaters
By
SpreadCheaters
You can watch a video tutorial here.
You have a set of data and need to find the 95% confidence interval.
Here is how to achieve this using built-in Add-ins:
Step 1 – Check your Add-ins

– Go to File in your ribbon and select Options.
– Click on Add-ins.
– Ensure that the dropdown menu next to Manage at the bottom is set to Excel Add-ins.
– Click on Go.
– Tick both the following boxes:
— Analysis ToolPack
— Solver Add-in
– Click OK.
Step 2 – Select the Analysis Tool

– Go to Data in your ribbon and select Data Analysis.
– Select Descriptive Statistics in the selection.
– Click on OK.
Step 3 – Set the Descriptive Statistics parameters
– Click on the Input Range text box.
– Select your data to be calculated.
– Tick the Output Range selection box.
– Click on the Output Range text box.
– Select a range of at least 16 rows to output information to.
– Tick the following boxes:
— Summary Statistics
— Confidence level for Mean
—- Set the box to 95
– Click OK.
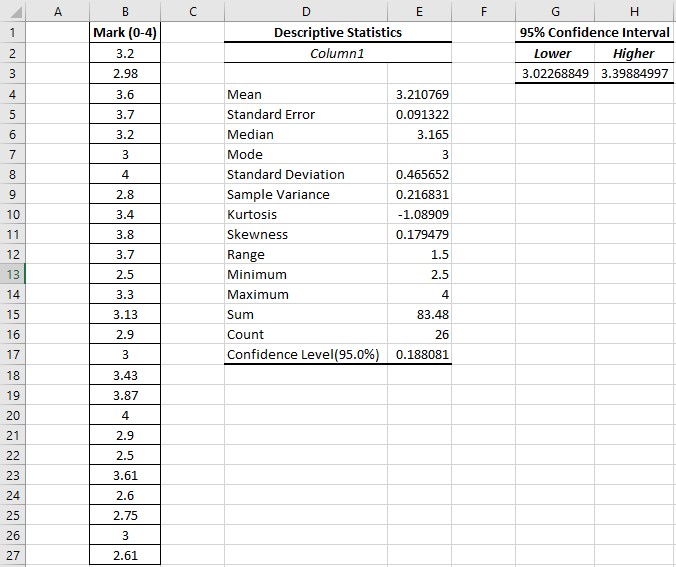
Step 4 – Calculate the confidence interval
– Select the cell you would like to see the lower value of the interval.
– Type =E4-E17, where E4 refers to the Mean value and E17 refers to the Confidence Level.
– Select the cell you would like to see the higher value of the interval.
– Type =E4+E17, where E4 refers to the Mean value and E17 refers to the Confidence Level.


