
How to find linear correlation coefficient in Excel
 By
SpreadCheaters
By
SpreadCheaters
The linear correlation coefficient, also known as Pearson’s correlation coefficient, measures the strength and direction of the linear relationship between two variables. It is a value between -1 and 1. In general, if the correlation coefficient is close to -1 or +1 then we can say that the bivariate data are strongly correlated to each other. If you get a 0 value then it means that bivariate data are not related to each other. The correlation coefficient is an important tool for identifying and understanding relationships between variables and can be used in a wide range of fields and applications.
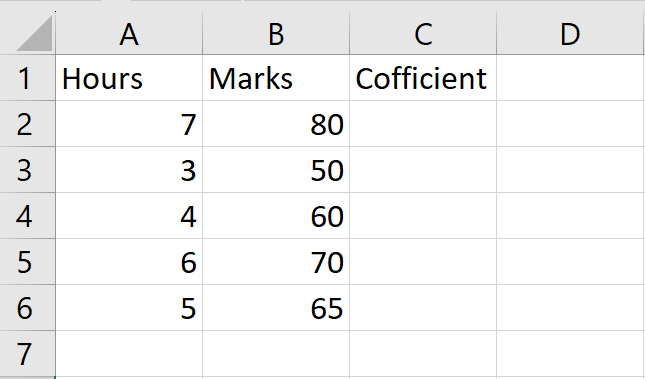
We have a dataset that includes the number of study hours of students and their corresponding marks for a test. We need to find the correlation coefficient to determine the strength and direction of the relationship between these variables. There are three methods to find the correlation coefficient. The following steps will guide you to use these methods.
Method 1: Find the Coefficient using the Correlation function
The correlation function in Excel is a statistical function that calculates the correlation coefficient between two arrays of data. The correlation coefficient is a measure of the strength and direction of the linear relationship between two variables.
The syntax for the correlation function in Excel is:
CORREL(Array1,Array2)
where array1 and array2 are the two arrays of data for which you want to calculate the Pearson correlation coefficient.
Step 1 – Select the Cell
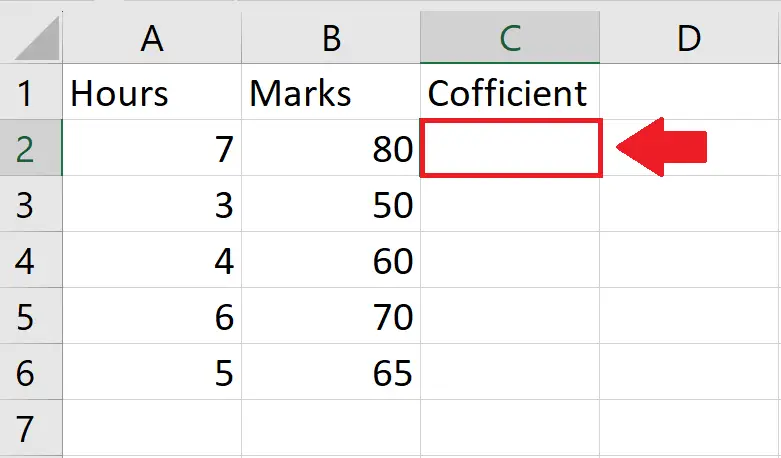
- Click on the cell, where you want to show the Correlation Coefficient
Step 2 – Use the Correlation function
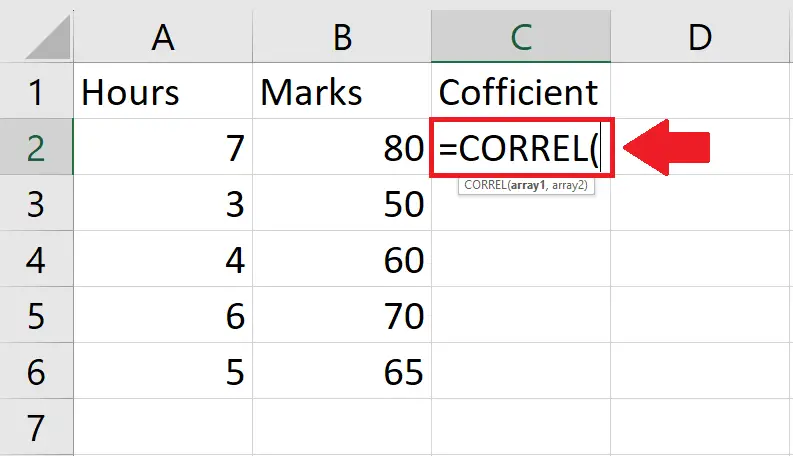
- After selecting the cell, type “=CORREL(” in the cell to use the Correlation function
Step 3 – Type the Arguments
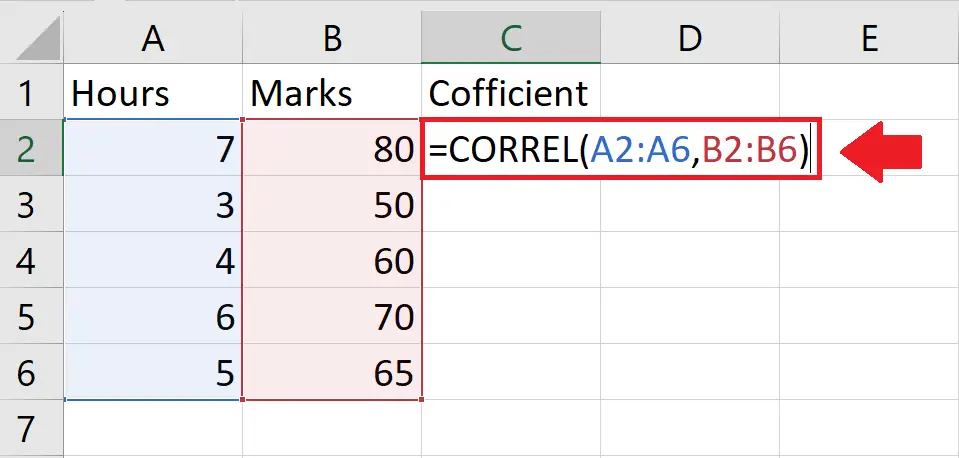
- After applying the Correlation function, type its arguments
- Array 1: A2:A6
- Array 2: B2:B6
- After typing the arguments, type the closing bracket “)”
Step 4 – Press the Enter key
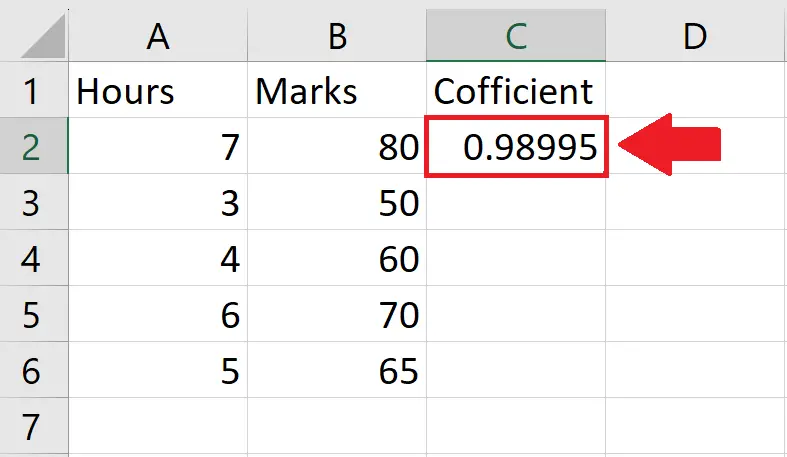
- After typing the arguments, press the Enter key to get the required result
Method 2: Find the Coefficient using the Pearson function
The Pearson function in Excel is used to calculate the Pearson correlation coefficient between two arrays of data. The Pearson correlation coefficient is a measure of the linear relationship between two variables.
The syntax for the Pearson function in Excel is:
PEARSON(array1, array2)
where array1 and array2 are the two arrays of data for which you want to calculate the Pearson correlation coefficient.
Step 1 – Select the Cell

- Click on the cell, where you want to show the Correlation Coefficient
Step 2 – Use the Pearson function
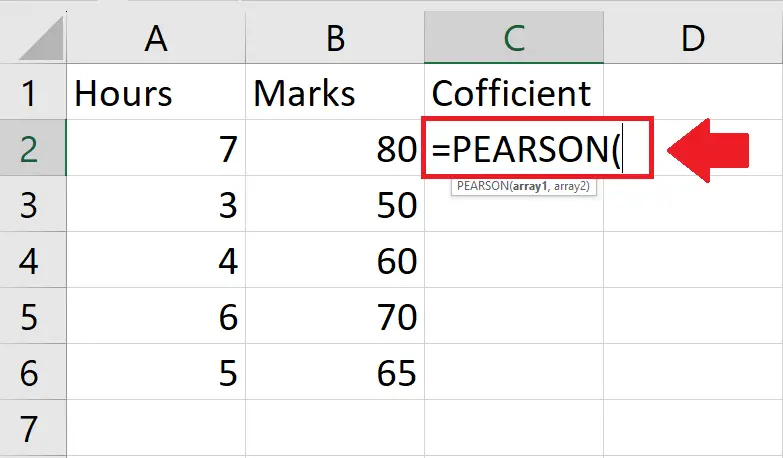
- After selecting the cell, type “=PEARSON(” in the cell to use the Correlation function
Step 3 – Type the Arguments
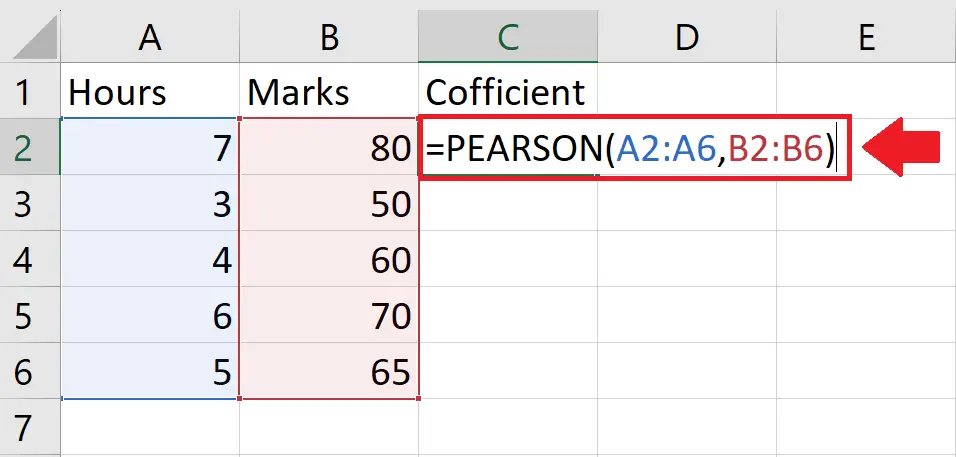
- After applying the Pearson function, type its arguments
- Array 1: A2:A6
- Array 2: B2:B6
- After typing the arguments, type the closing bracket “)”
Step 4 – Press the Enter key

- After typing the arguments of the function, press the Enter key to get the required result
Method 3: Find the Coffient using the Graph
Step 1 – Select the range of cells
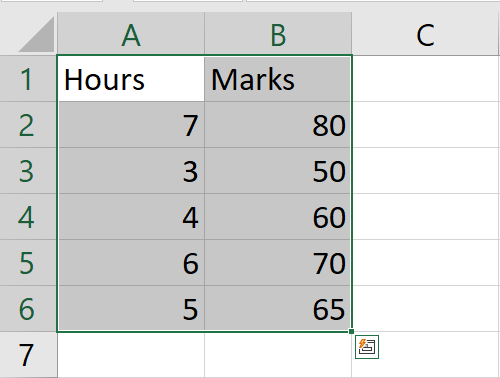
- Select the range of cells for which you want to show the correlation coefficient
Step 2 – Apply a Scatter Chart
- After selecting the range of cells, click on the Scatter chart option in the Charts option of the Insert tab
- And a chart will appear on the screen
Step 3 – Add a Trend line
- Click on the Chart Element option at the top of the chart and a right-side menu will appear
- From this menu, click on the Trend line option to add a trend line on the chart
Step 4 – Open the Format Trend Line dialog box
- After applying the trend line, click on the arrow next to the trend line option and a right-side menu will appear
- From this menu, click on More options, and a Format Trend Line dialog box will appear on the right side of the sheet
Step 5 – Click on the Display R – squared Value option
- In the Format Trend Line dialog box, click on the Display R squared Value on the chart option to get the correlation coefficient on the graph


