
How to find F-statistic in excel.
 By
SpreadCheaters
By
SpreadCheaters
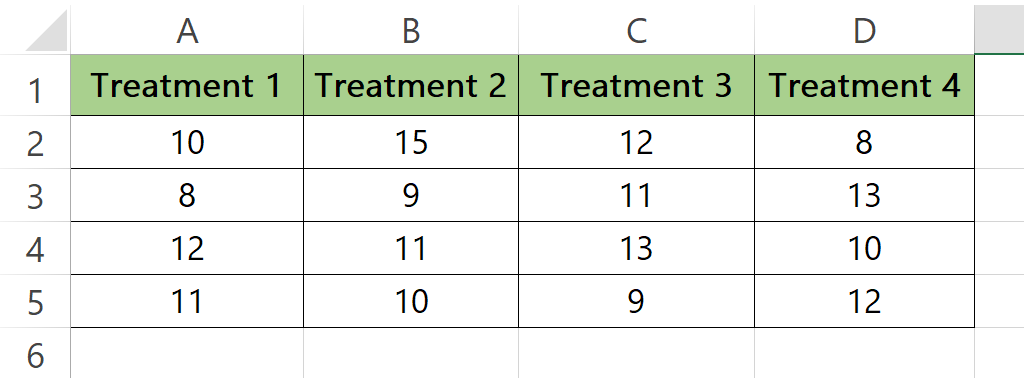
Here we have a sample dataset that contains the results of an experiment where four different treatments were tested on a group of subjects. The values in columns represent the results for each treatment. In this tutorial, we learn how to perform F-statistic on the given data by following the simple steps below. Let’s have a look at the dataset first.
The F-statistic is a widely used test statistic in statistical analysis, which helps to evaluate the equality of variances or means between two or more groups of data. It is a critical tool for testing hypotheses and making informed decisions based on statistical data. Microsoft Excel, with its built-in functions, provides an easy and efficient way to calculate the F-statistic, which is especially helpful for those who work with large datasets and want to analyze their data in a structured manner.
Step – 1 Open Options.
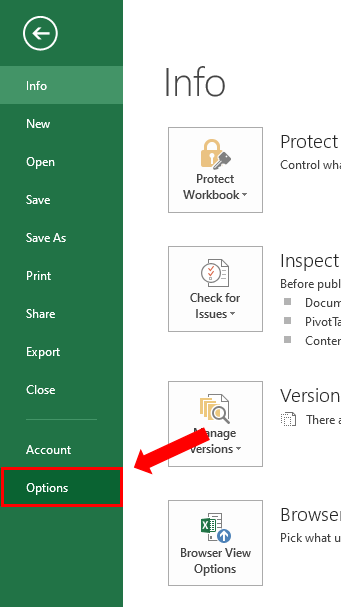
– First we have to enable the option of Data Analysis.
– Click on the File on the top left.
– Click on the options in the bottom left.
Step – 2 Enabling the Data Analysis option.
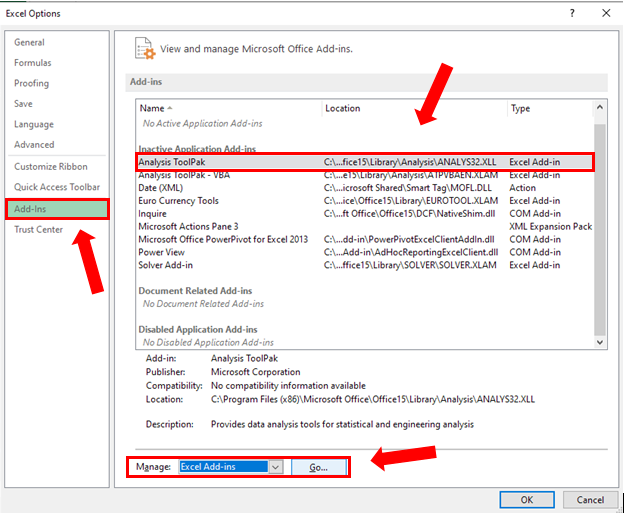
After you click on Options, the Excel Options menu will appear.
Click Add-Ins.
Choose Analysis ToolPak as shown below.
Then in the Manage box below make sure Excel Add-Ins is selected.
Click Go.
Step – 3 Analysis ToolPak.
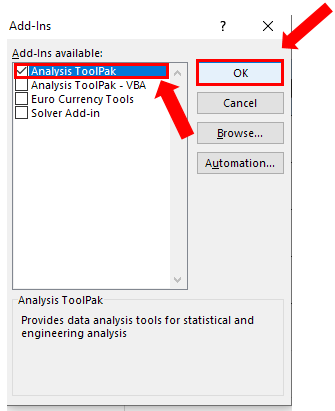
In the Add-Ins menu check the box of Analysis ToolPak.
Click OK.
Step – 4 Open Data Analysis option.
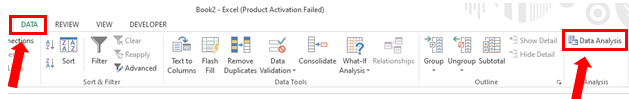
Now your Data analysis option has been enabled.
Click on the Data tab.
Click on Data Analysis in the Analysis group.
Step – 5 Applying the F-test.
On the Data Analysis menu there will be Analysis Tools.
Select F-Test Two-Sample for Variances option then click on OK.
In the F-Test Two-Sample for Variances menu, In the Input group select the Variable 1 and Variable 2 ranges.
In the Output Options select the output range as shown below.
Click OK.
Conclusion:
The F-test is a statistical test used to compare the variances of two populations. In Excel, the F-test is commonly used to test the null hypothesis that two samples have the same variance.
The benefit of using the F-test in Excel is that it allows you to determine if two sets of data have a similar degree of variability. This information can be useful in a variety of contexts, such as quality control, experimental design, and data analysis.


