
How to find best fit line in Excel
 By
SpreadCheaters
By
SpreadCheaters
Page last updated:
26/04/2023 |
Next review date:
26/04/2025
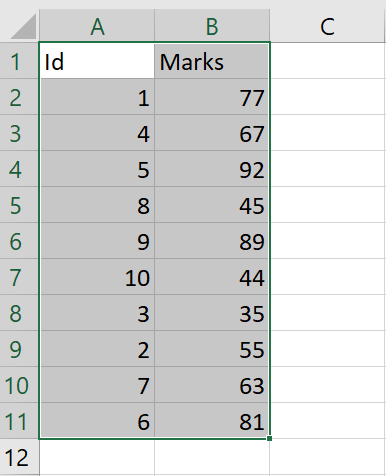
In Excel, finding the best fit line means using a statistical method that represents the relationship between the two variables of a dataset. The best fit line is important because it helps you determine the relationship between the two variables, make predictions, and identify outliers.
Our dataset comprises two columns representing the relationship between student ID numbers and their corresponding numerical values. We want to generate a best fit line on the graph, and there are two ways to do this: the first is to create a best fit line directly from the graph, and the second is to form a best fit line from the taskbar.
Method 1: Form a line that fits best to the Graph
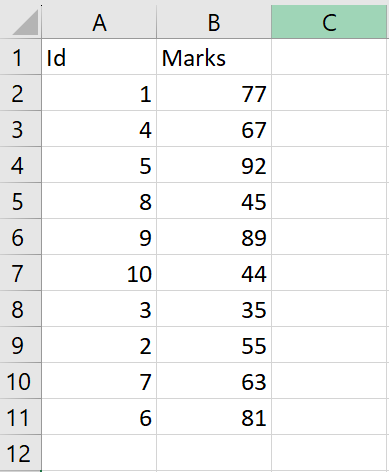
Step 1 – Select the range of cells

- Select the range of cells for which you want to form the graph
Step 2 – Insert Scatter or Bubble Chart
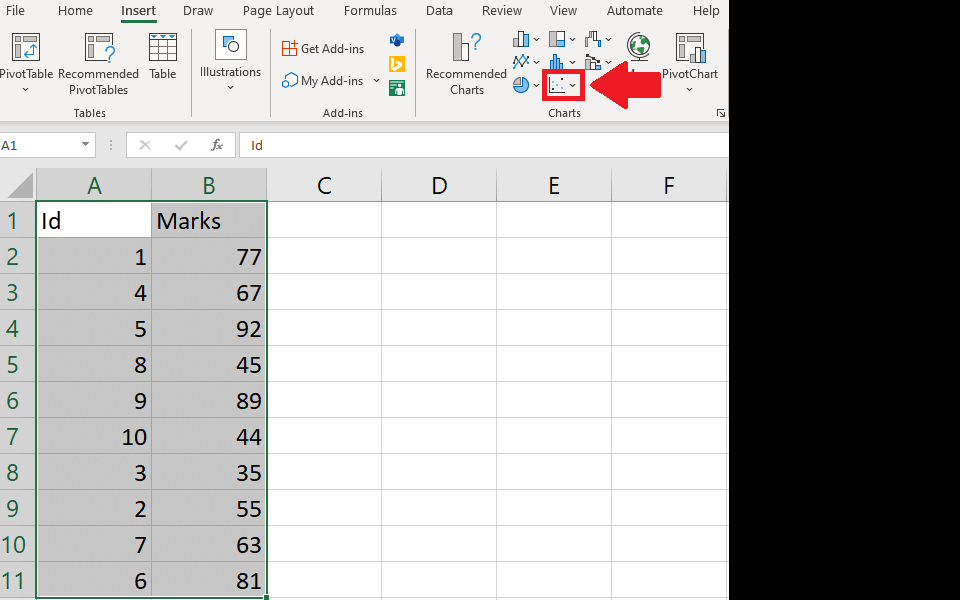
- Click on the Insert Scatter or Bubble Chart option from the charts group of the Insert tab and a Chart will appear on the sheet
Step 3 – Open the Chart Elements Menu
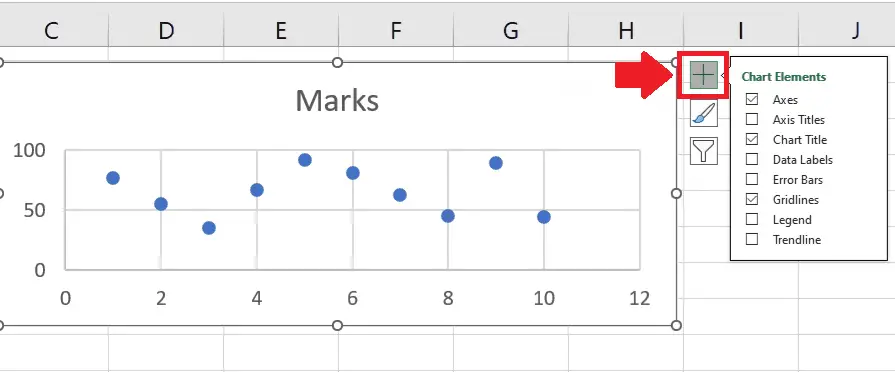
- Click on the Chart to select it
- After selecting the chart, click on the Chart Elements and a right-side menu will appear
Step 4 – Select the suitable option
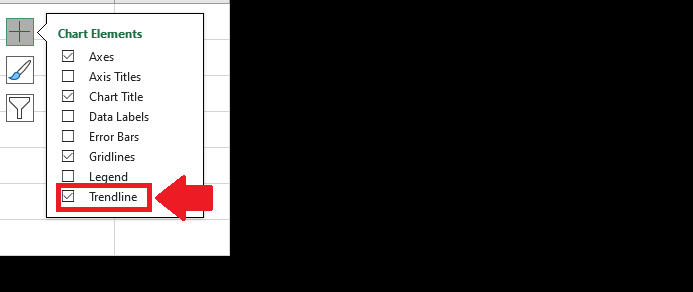
- From the dropdown menu, click on the Trendline option to get the required result
Method 2: Draw the Best fitting line using the toolbar options
Step 1 – Select the range of cells
- Select the range of cells for which you want to form the graph
Step 2 – Click on the Insert Scatter or Bubble Chart option

- Click on the Insert Scatter or Bubble Chart option from the charts group of the Insert tab and a Chart will appear on the sheet
Step 3 – Locate the Add Chart Elements option
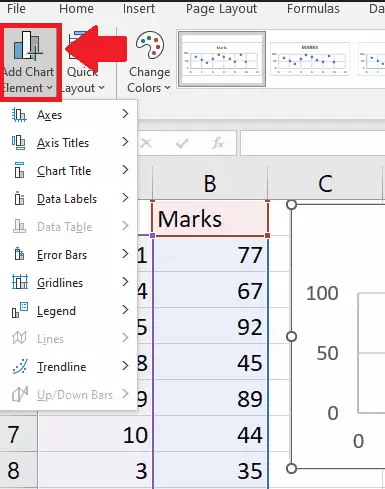
- Click on the Add Chart Elements option from the Chart Layouts group of the Chart Design tab and a dropdown menu will appear
Step 4 – Open Trendline options
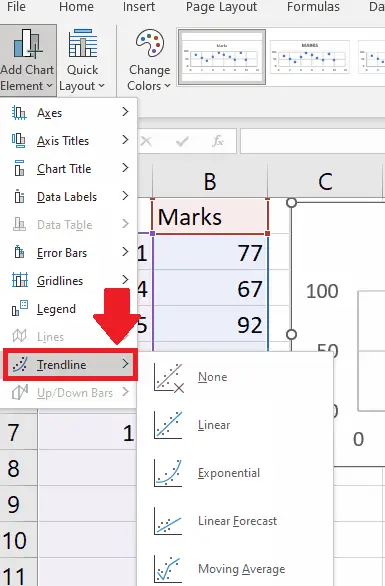
- From the dropdown menu, click on the Trendline option and a right-side menu will appear
Step 5 – Select the type of Trendline
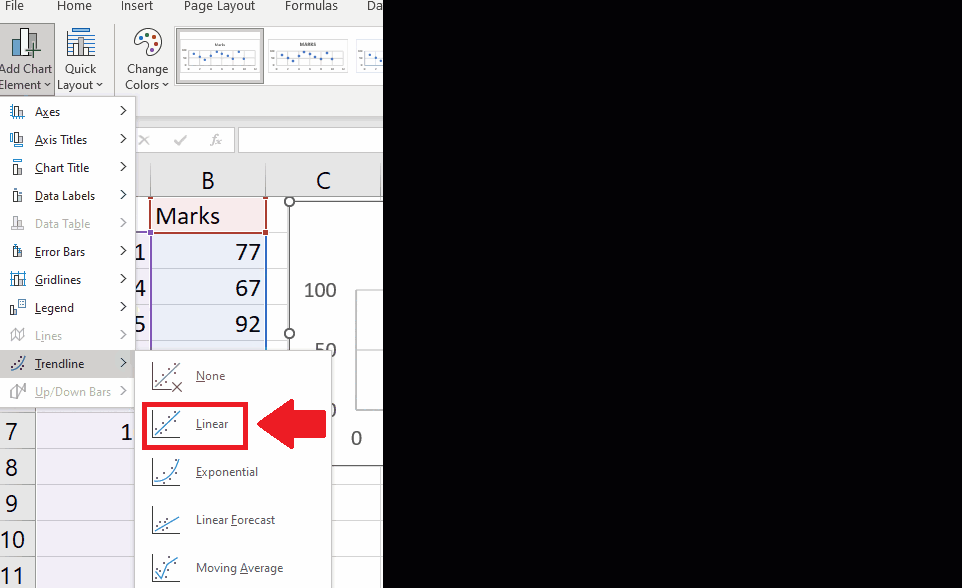
- From the right side menu, click on the type of trendline you want to show on the graph to get the required result
- Here we have selected a Linear trendline, you may select any other type, depending upon the nature of your data.


