
How to extrapolate data from a table
 By
SpreadCheaters
By
SpreadCheaters
Extrapolation is a statistical technique used to estimate values that are beyond the range of a given set of data. It is commonly used in finance, engineering, and other fields to predict trends and make informed decisions. In this blog post, we will explore how to Extrapolate data from a table in Excel.
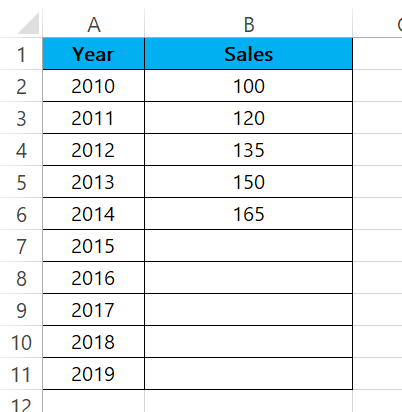
Here we have a dataset that contains two columns: Years and Sales. In the dataset from year 2015 to 2019 sales values are unknown, we will be using the Extrapolation technique to predict the sales from year 2015 to 2019. Let’s have a look at the dataset first.
Method – 1 Using the formula for Extrapolation.
The generic form of linear interpolation formula used to estimate a value between two known data points is:
y = y1 + (x – x1) * ((y2 – y1) / (x2 – x1))
where:
x1 and y1 are the x and y values of the first data point
x2 and y2 are the x and y values of the second data point
x is the x value for which you want to estimate a corresponding y value
y is the estimated y value for x
Step – 1 Type the formula.
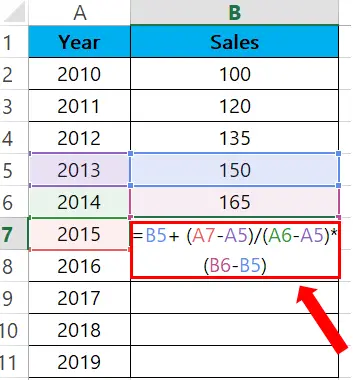
- Select the cell where you want to show the result.
- The formula we used for extrapolation is:
=B5+(A7-A5)/(A6-A5)*(B6-B5)
- Formula breakdown:
B5 and B6 are the known values in the y-axis (dependent variable)
A5 and A6 are the known values in the x-axis (independent variable)
A7 is the value in the x-axis at which you want to predict the corresponding value in the y-axis.
Step – 2 Find the rest of the values.
- Select the cell where you typed the formula.
- Click on the bottom right of the cell and drag it to the rest of the cells as shown above.
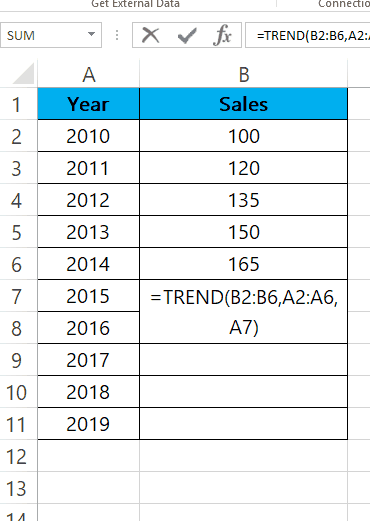
Method – 2 TREND formula for Extrapolation.
Step – 1 Type the formula.
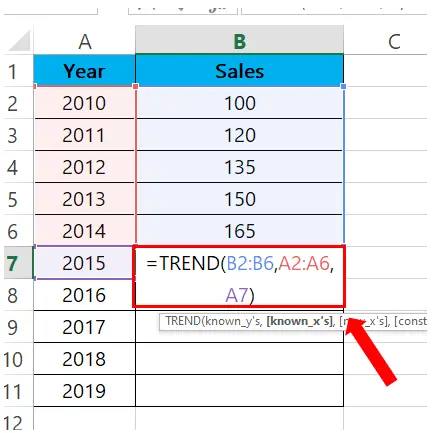
- Select the cell where you want to type the formula.
- Then type the formula:
=TREND(B2:B6, A2:A6, A7)
- Formula breakdown:
=TREND(known_y’s, known_x’s, new_x’s)
known_y’s: This is the range of dependent variables (y-values) for which you have data.
known_x’s: This is the range of independent variables (x-values) for which you have data.
new_x’s: This is the range of independent variables (x-values) for which you want to predict new y-values.
Step – 2 Find the rest of the values.
- Select the cell where you typed the formula.
- Click on the bottom right of the cell and drag it to the rest of the cells as shown above.
Method – 3 Forecast formula for Extrapolation.
Step – 1 Type the formula.
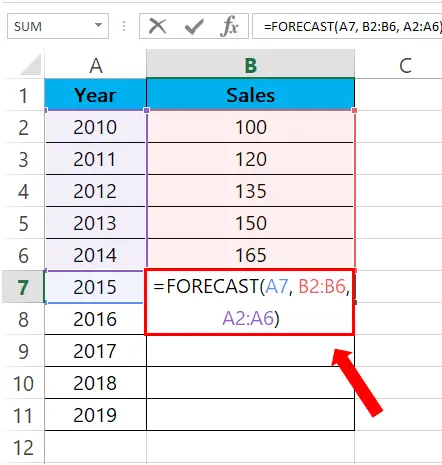
- Select the cell where you want to type the formula.
FORECAST(A7,B2:B6,A2:A6)
- Formula Breakdown:
=FORECAST(x,known_y’s,known_x’s)
x: This is the x-value for which you want to predict a new y-value.
known_y’s: This is the range of dependent variables (y-values) for which you have data.
known_x’s: This is the range of independent variables (x-values) for which you have data.
Step – 2 Find the rest of the values.
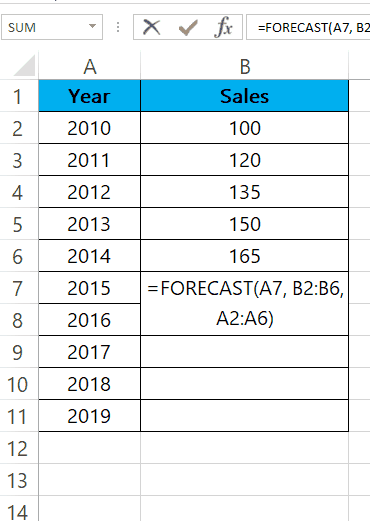
- Select the cell with the formula.
- Click on the bottom right of the cell and drag it to the rest of the cells as shown above.
Method – 4 Graph for Extrapolation.
Step – 1 Select the Table.
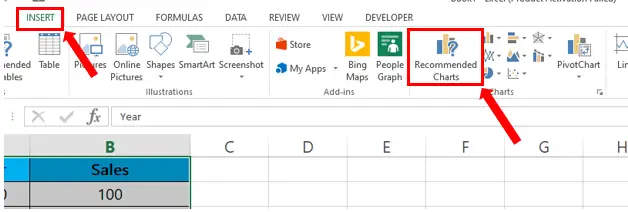
- Select the dataset.
- Go to the Insert tab.
- In the Charts group click on Recommended Charts.
Step – 2 Insert The Graph.
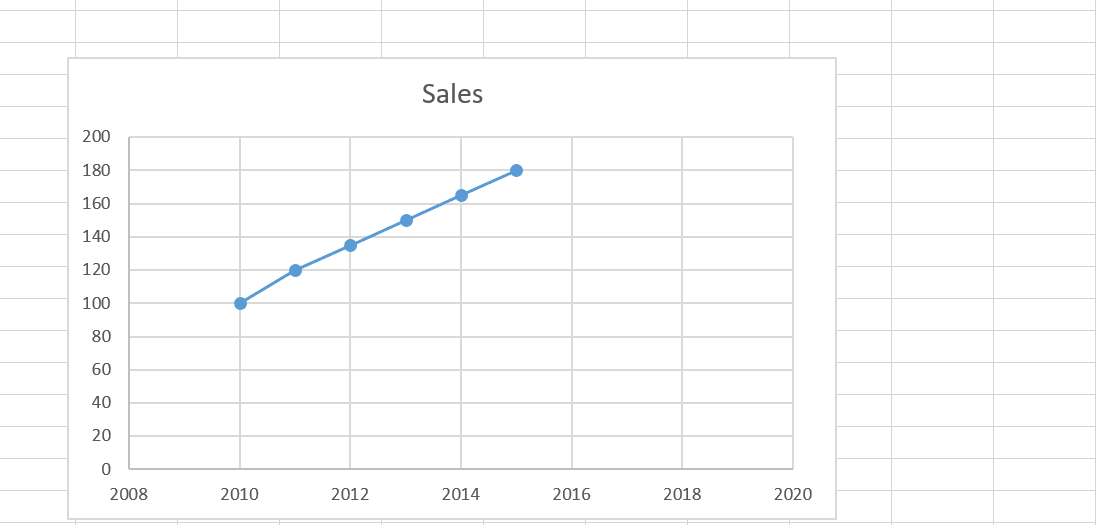
- After clicking on the Recommended Chart., click on the appropriate graph.
- After the graph has been added, click on it.
- Then click on the plus sign, and it will show the Chart Elements.
- Check the checkbox of Trendline.
- Then the graph will show the prediction of sales from 2015 to 2019.


