
How to do multiple regression in Excel
 By
SpreadCheaters
By
SpreadCheaters
You can watch a video tutorial here.

When working with predictive analytics, you may need to perform regression analysis on a set of dependent and independent variables. In Excel, you can perform the regression using the Data Analysis tool. In this example, we use the kilometers driven and the type of fuel to determine the selling price of the car.
Note: If the Data Analysis button is present under Data > Analyze, then skip steps 1 to 3
Step 1 – Open the Excel Options window
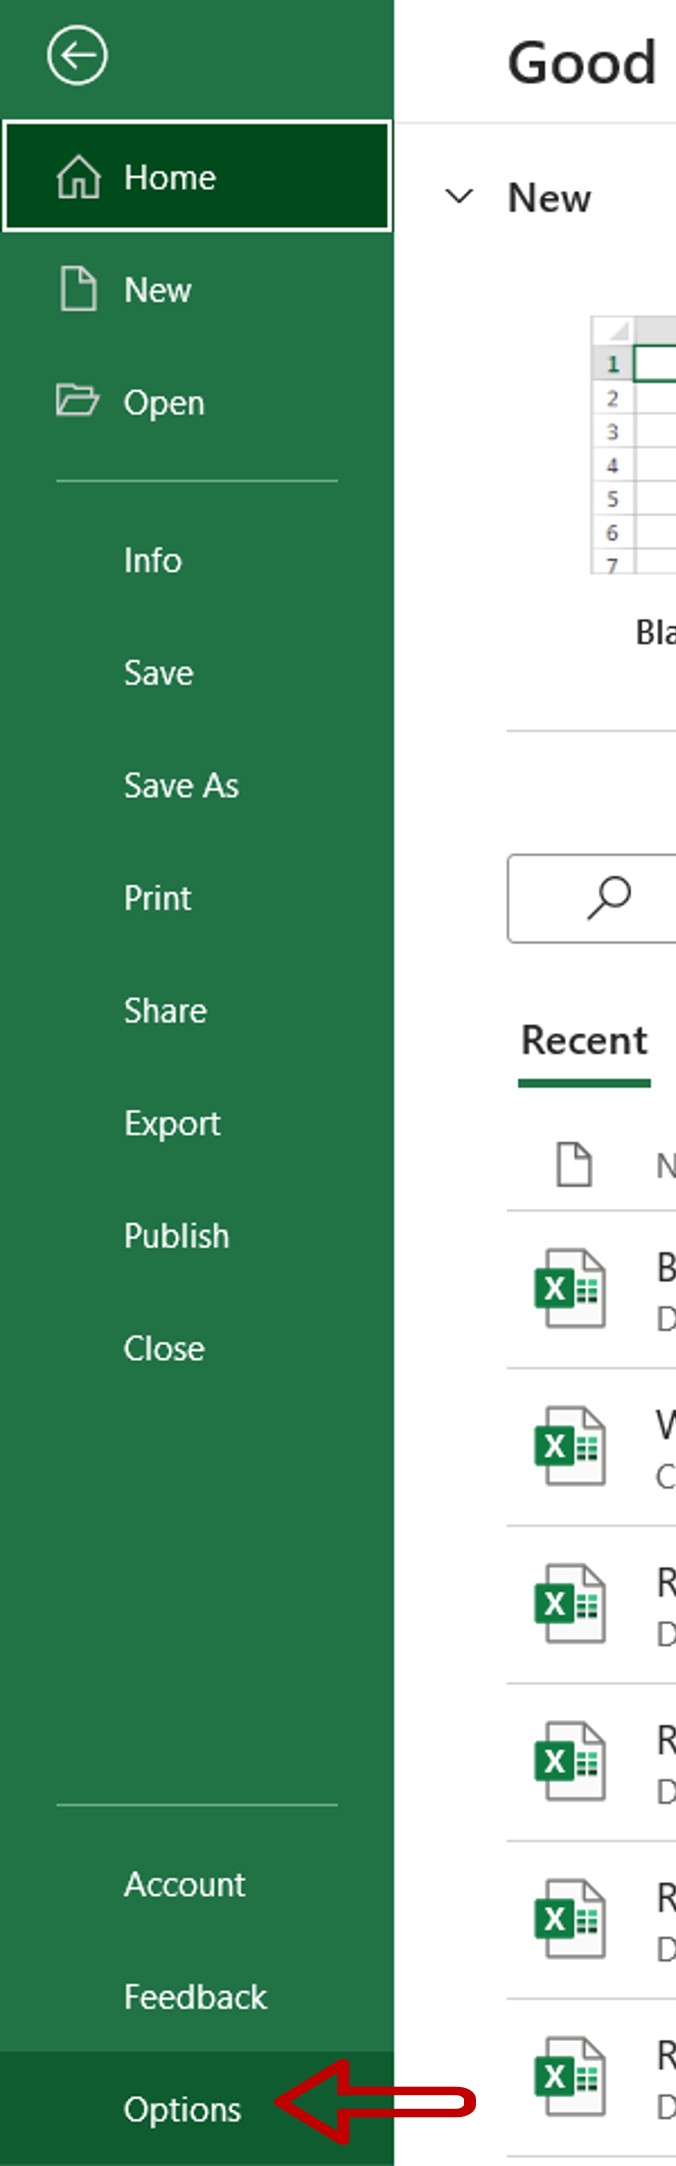
– Go to File > Options
Step 2 – Manage the Add-ins
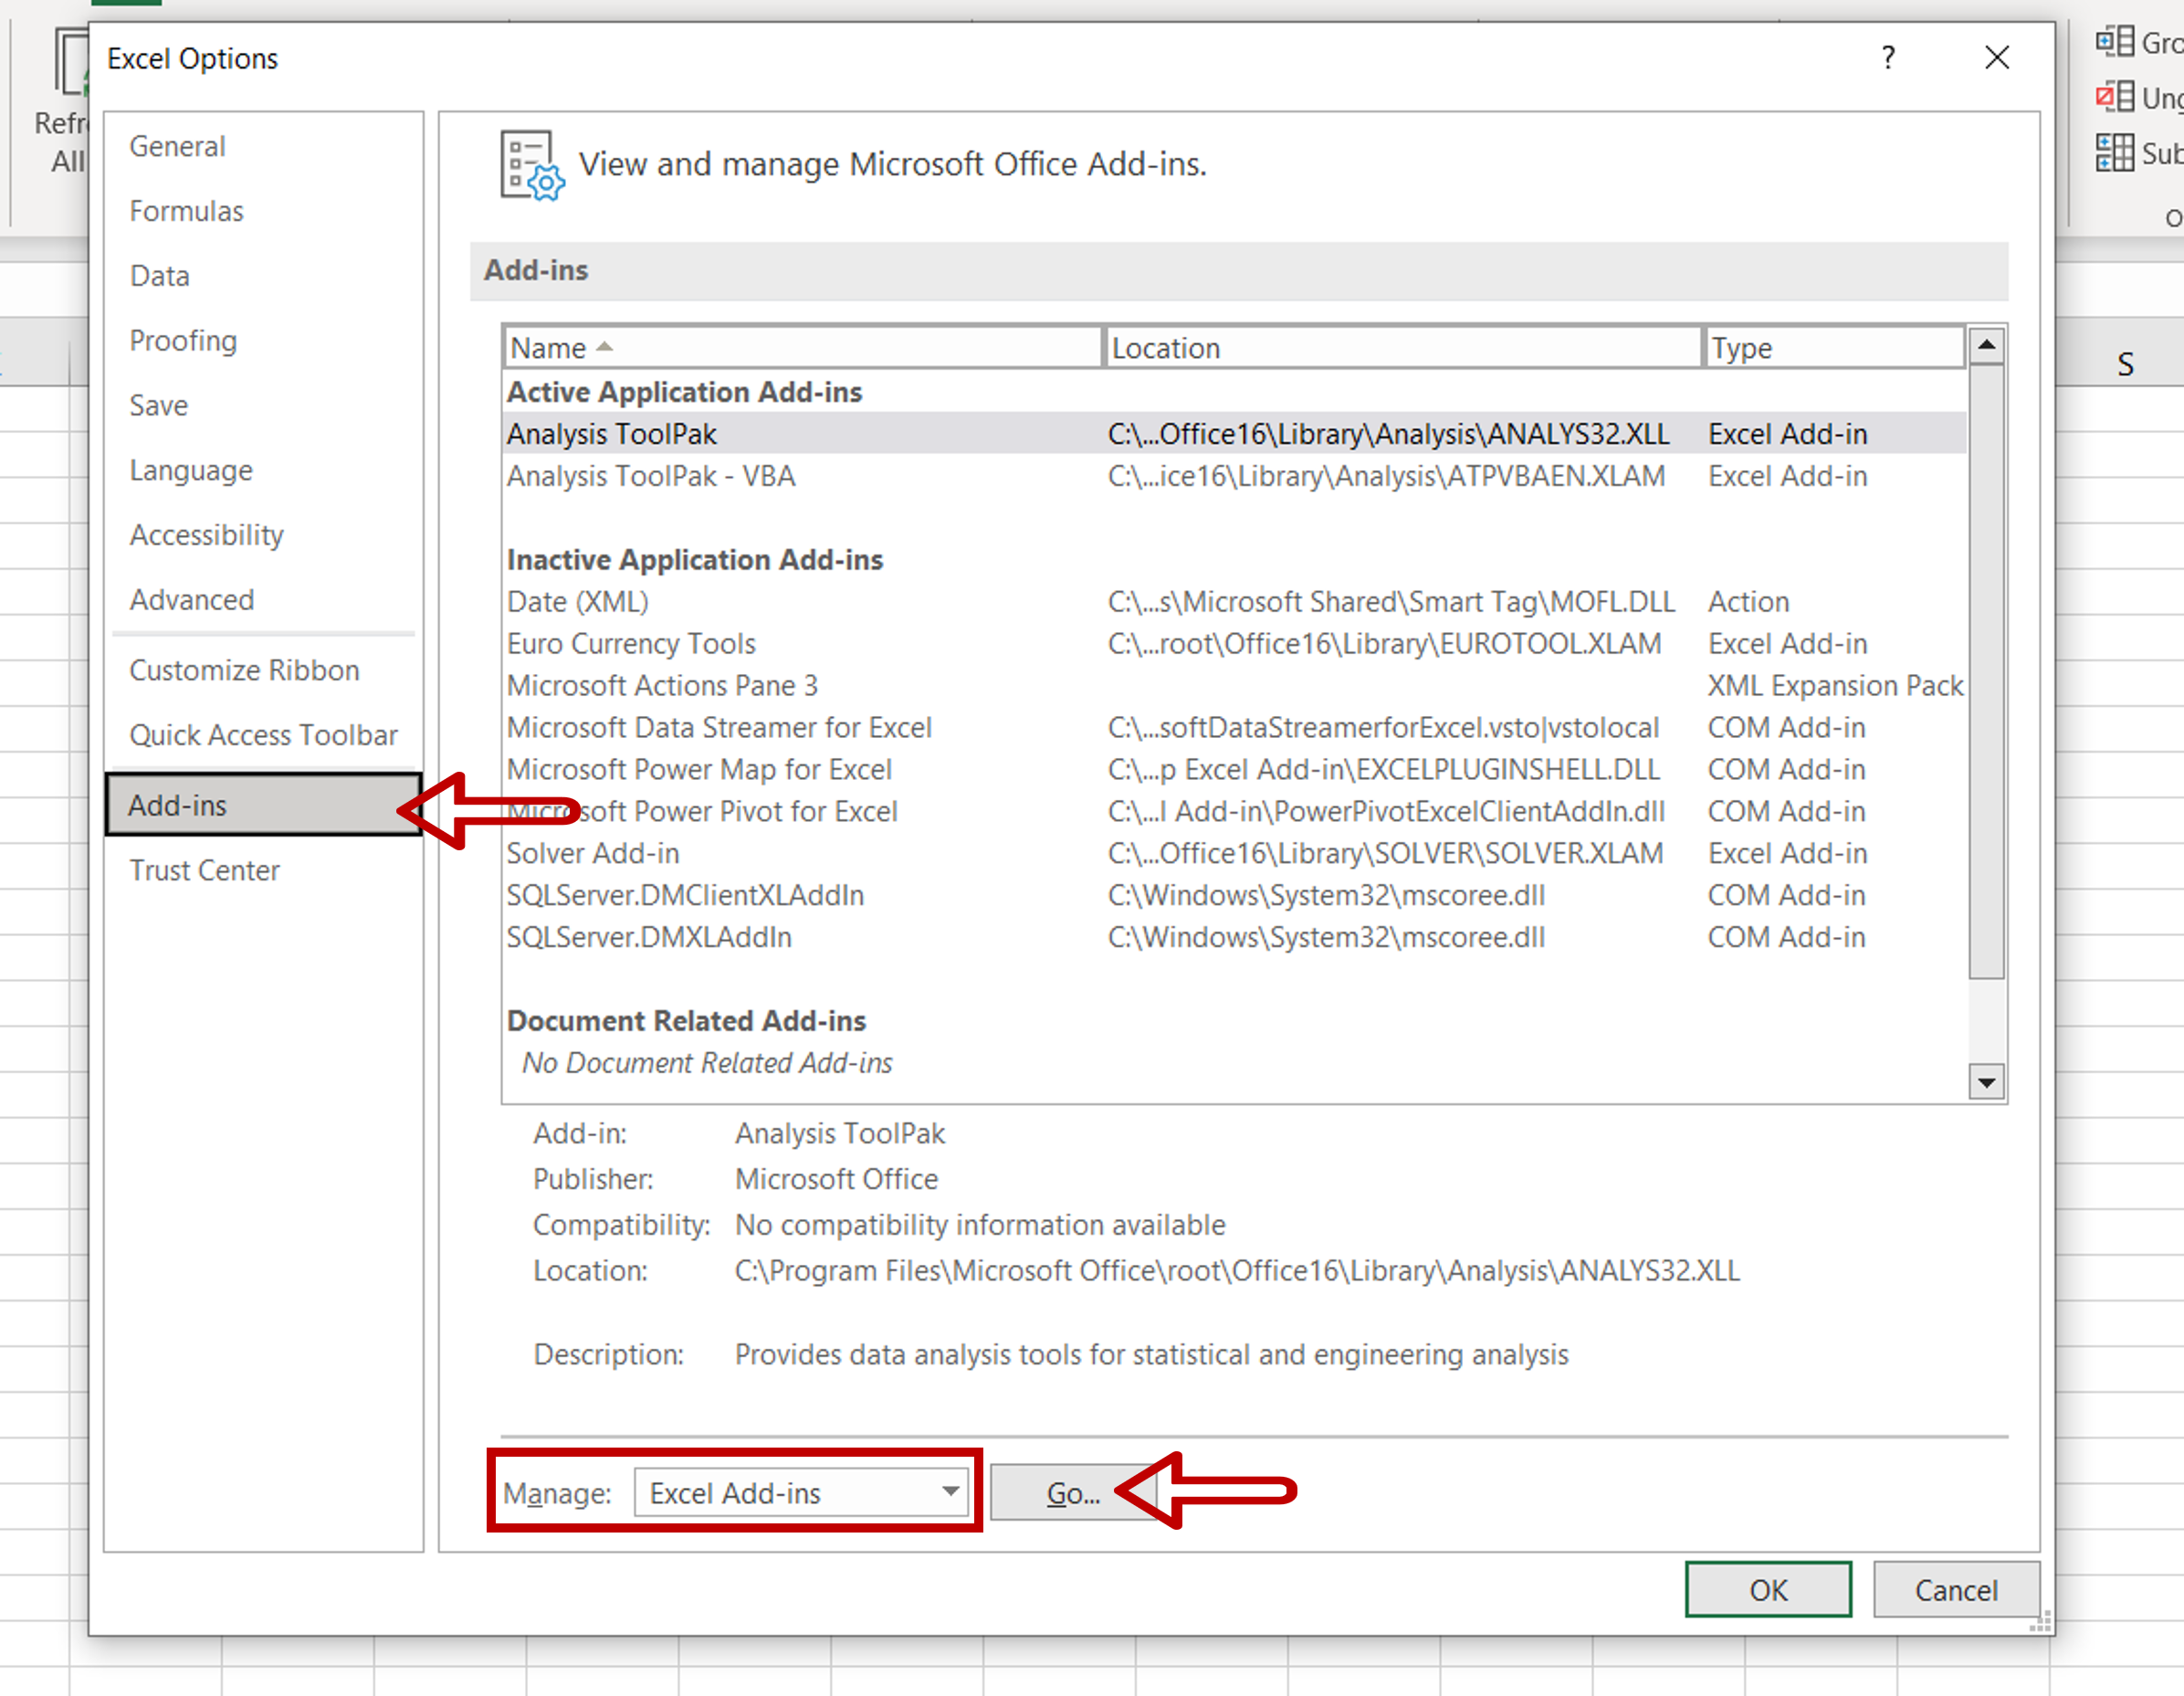
– Go to Add-ins
– Select Excel Add-ins from the Manage drop-down
– Click Go
Step 3 – Load the Analysis ToolPak add-in
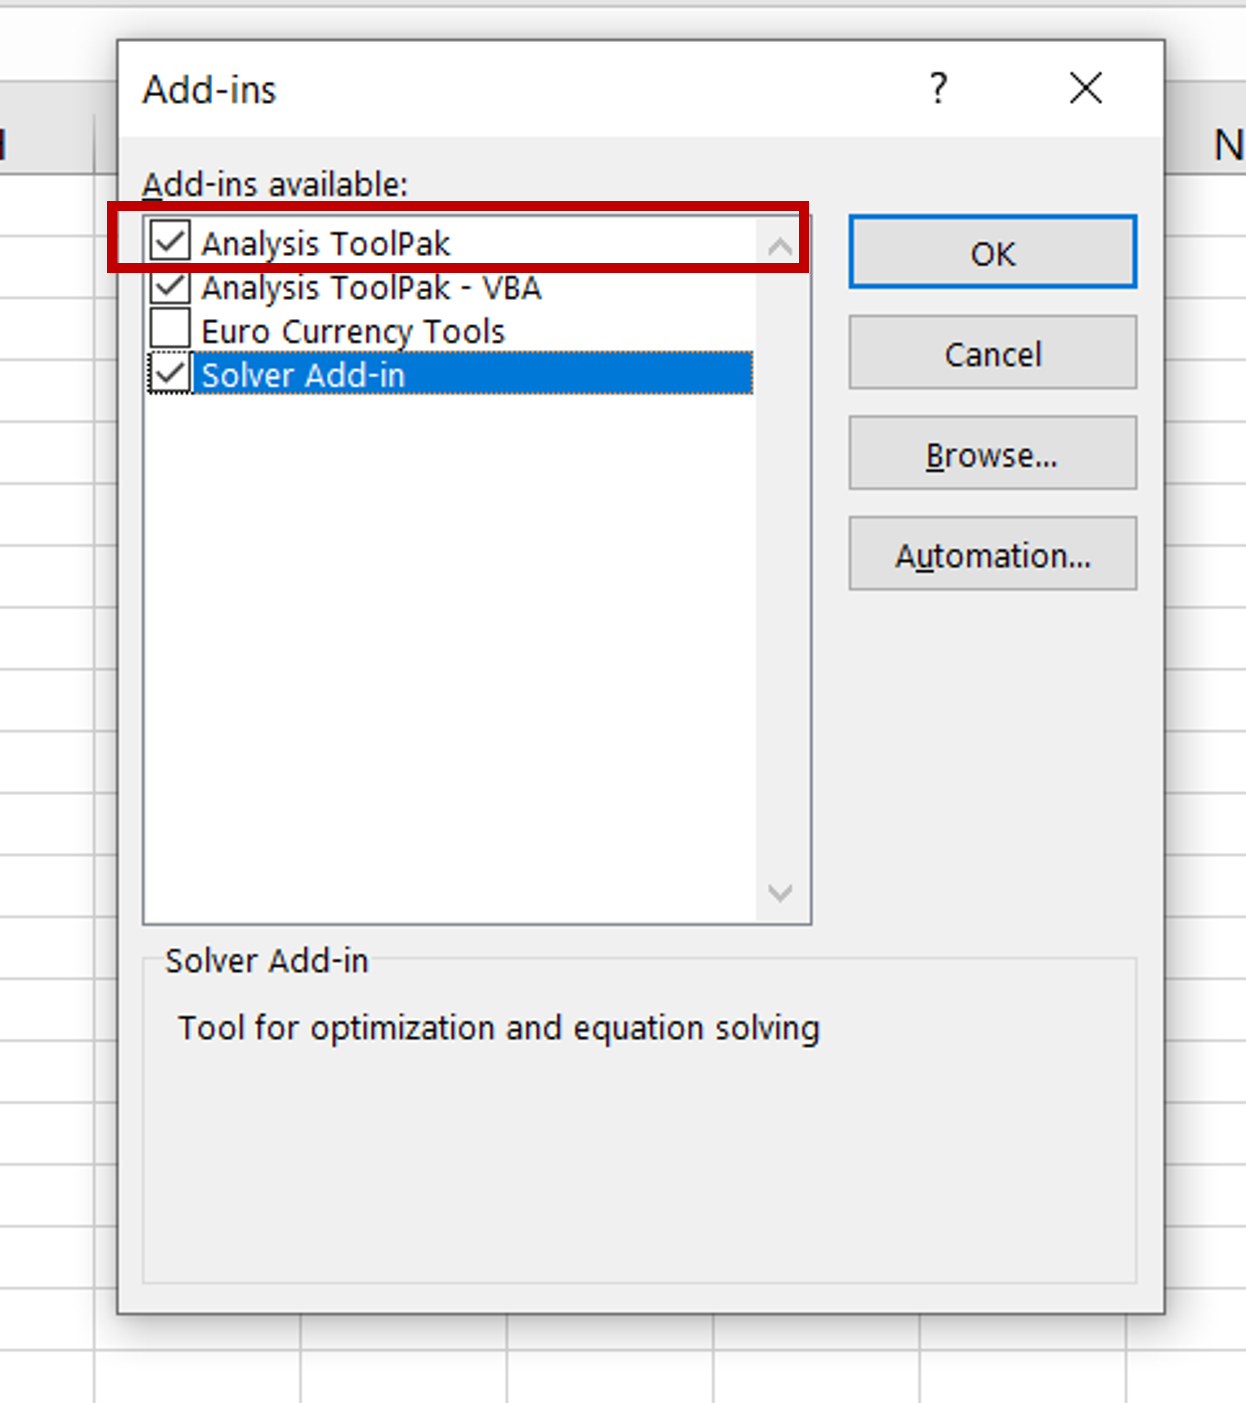
– Select Analysis ToolPak
– Click OK
Step 4 – Open the Regression window
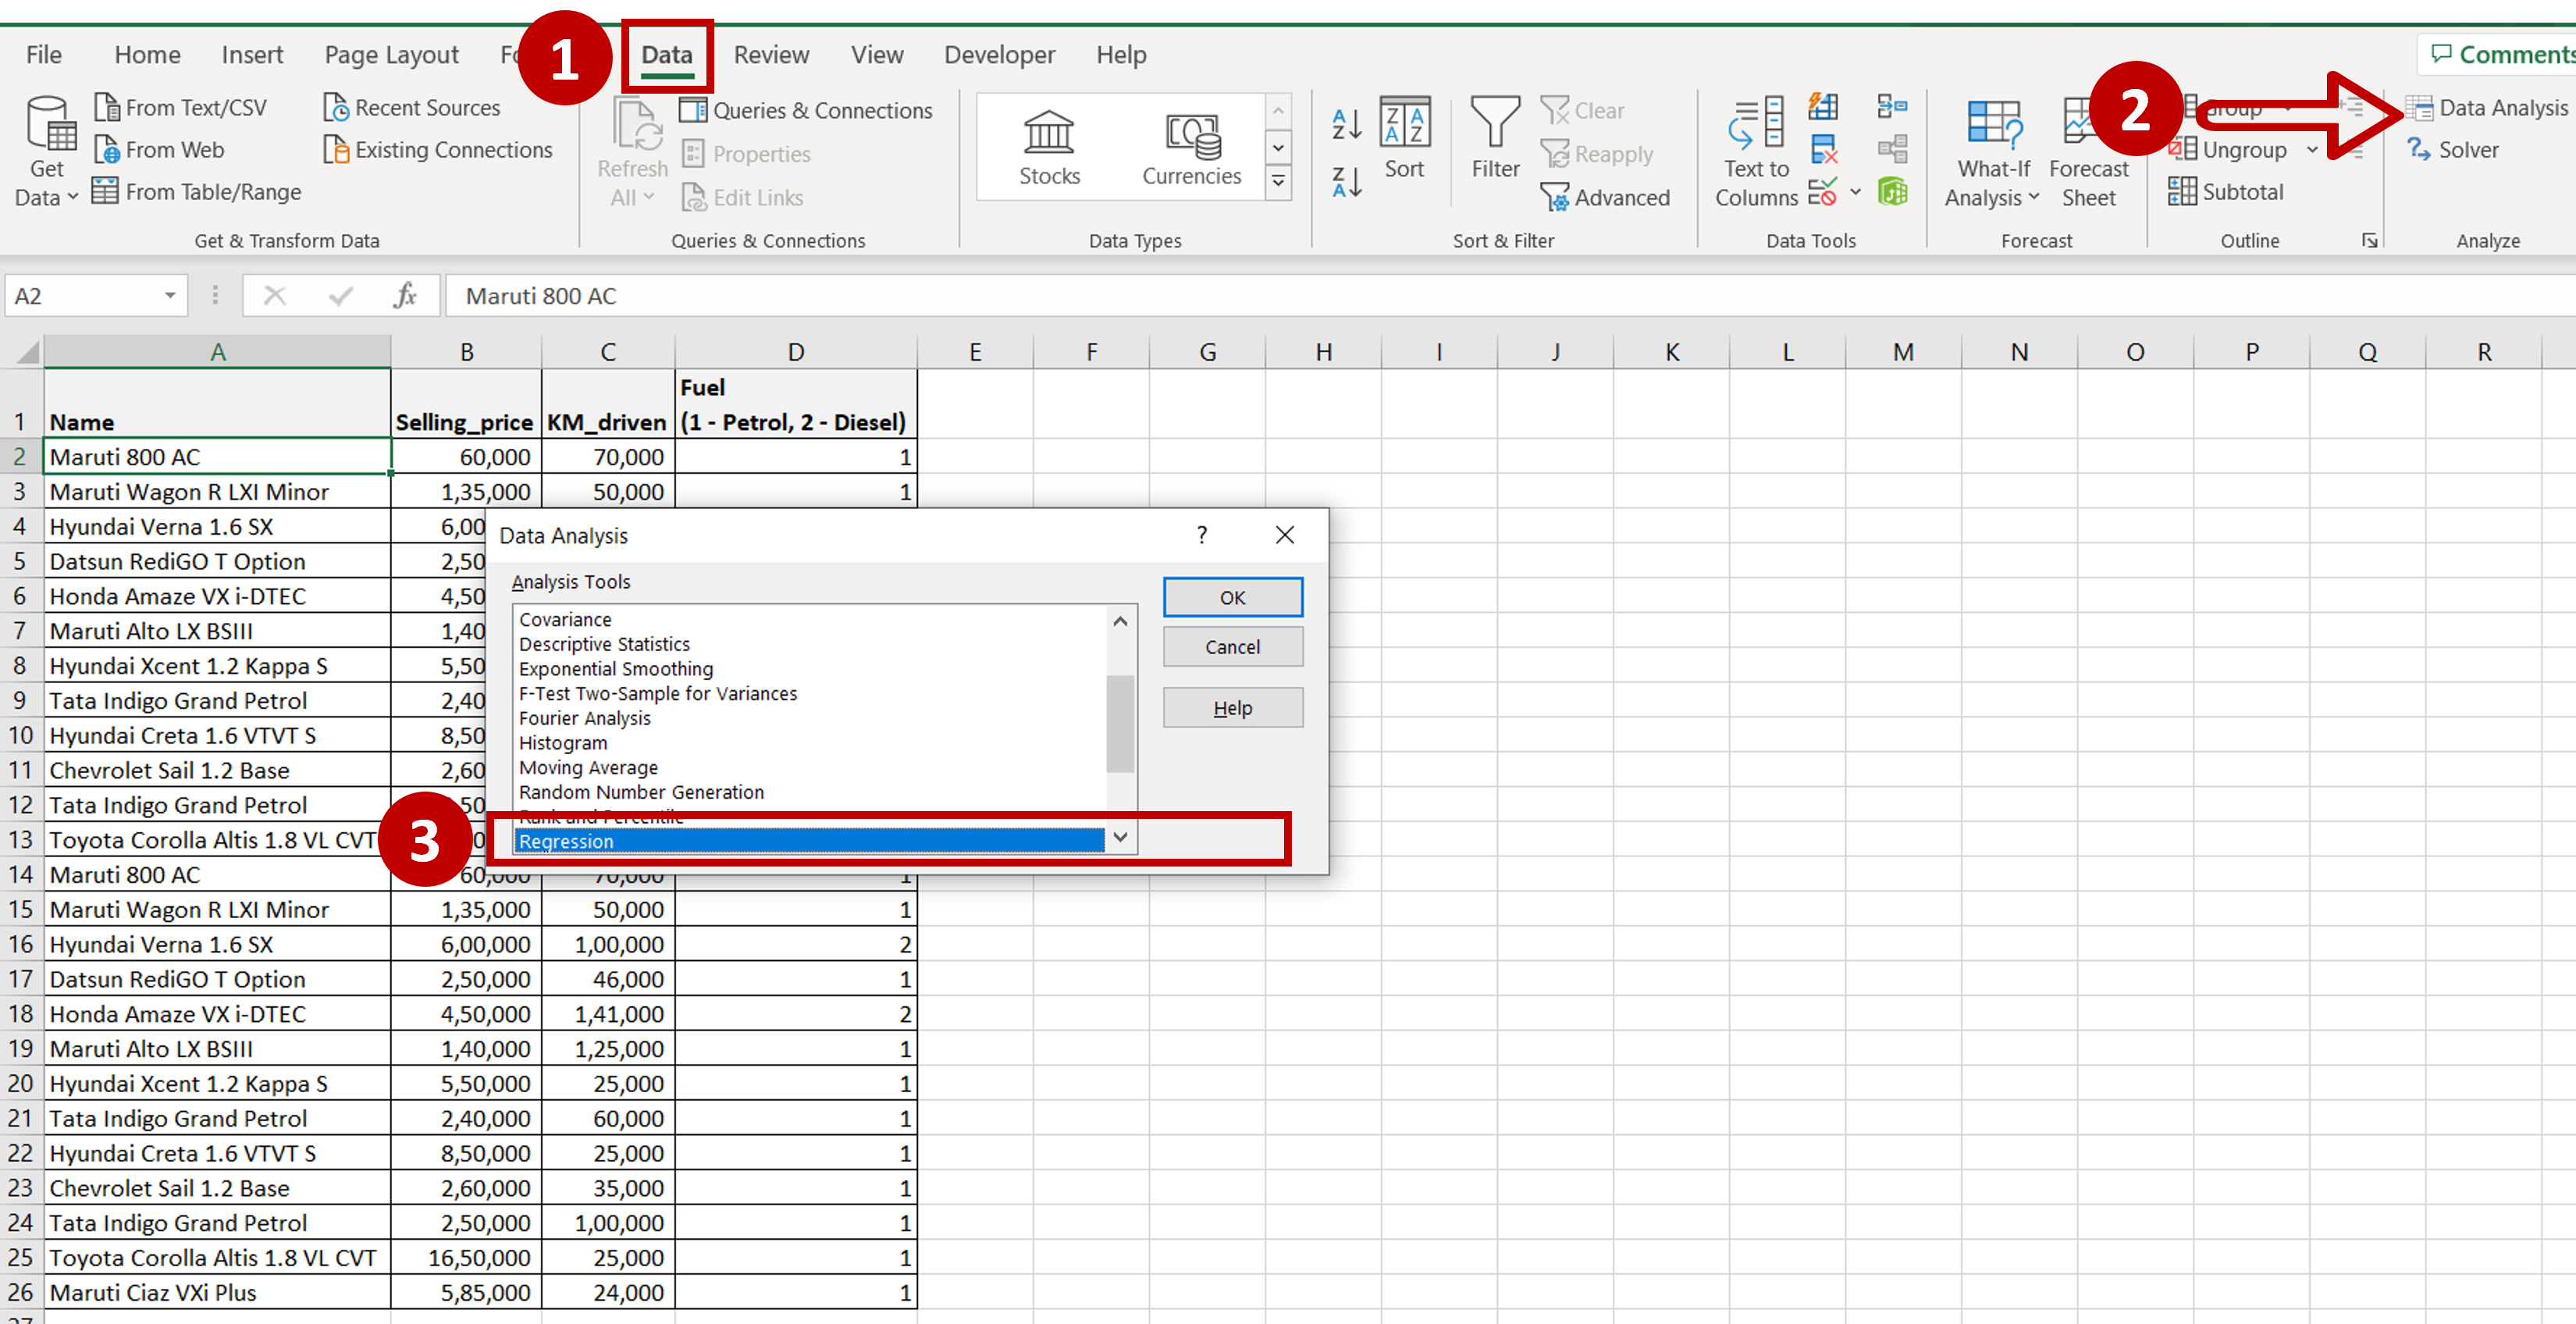
– Go to Data > Analyze
– Click on the Data Analysis button
– In the window, select Regression
– Click OK
Step 5 – Set the parameters
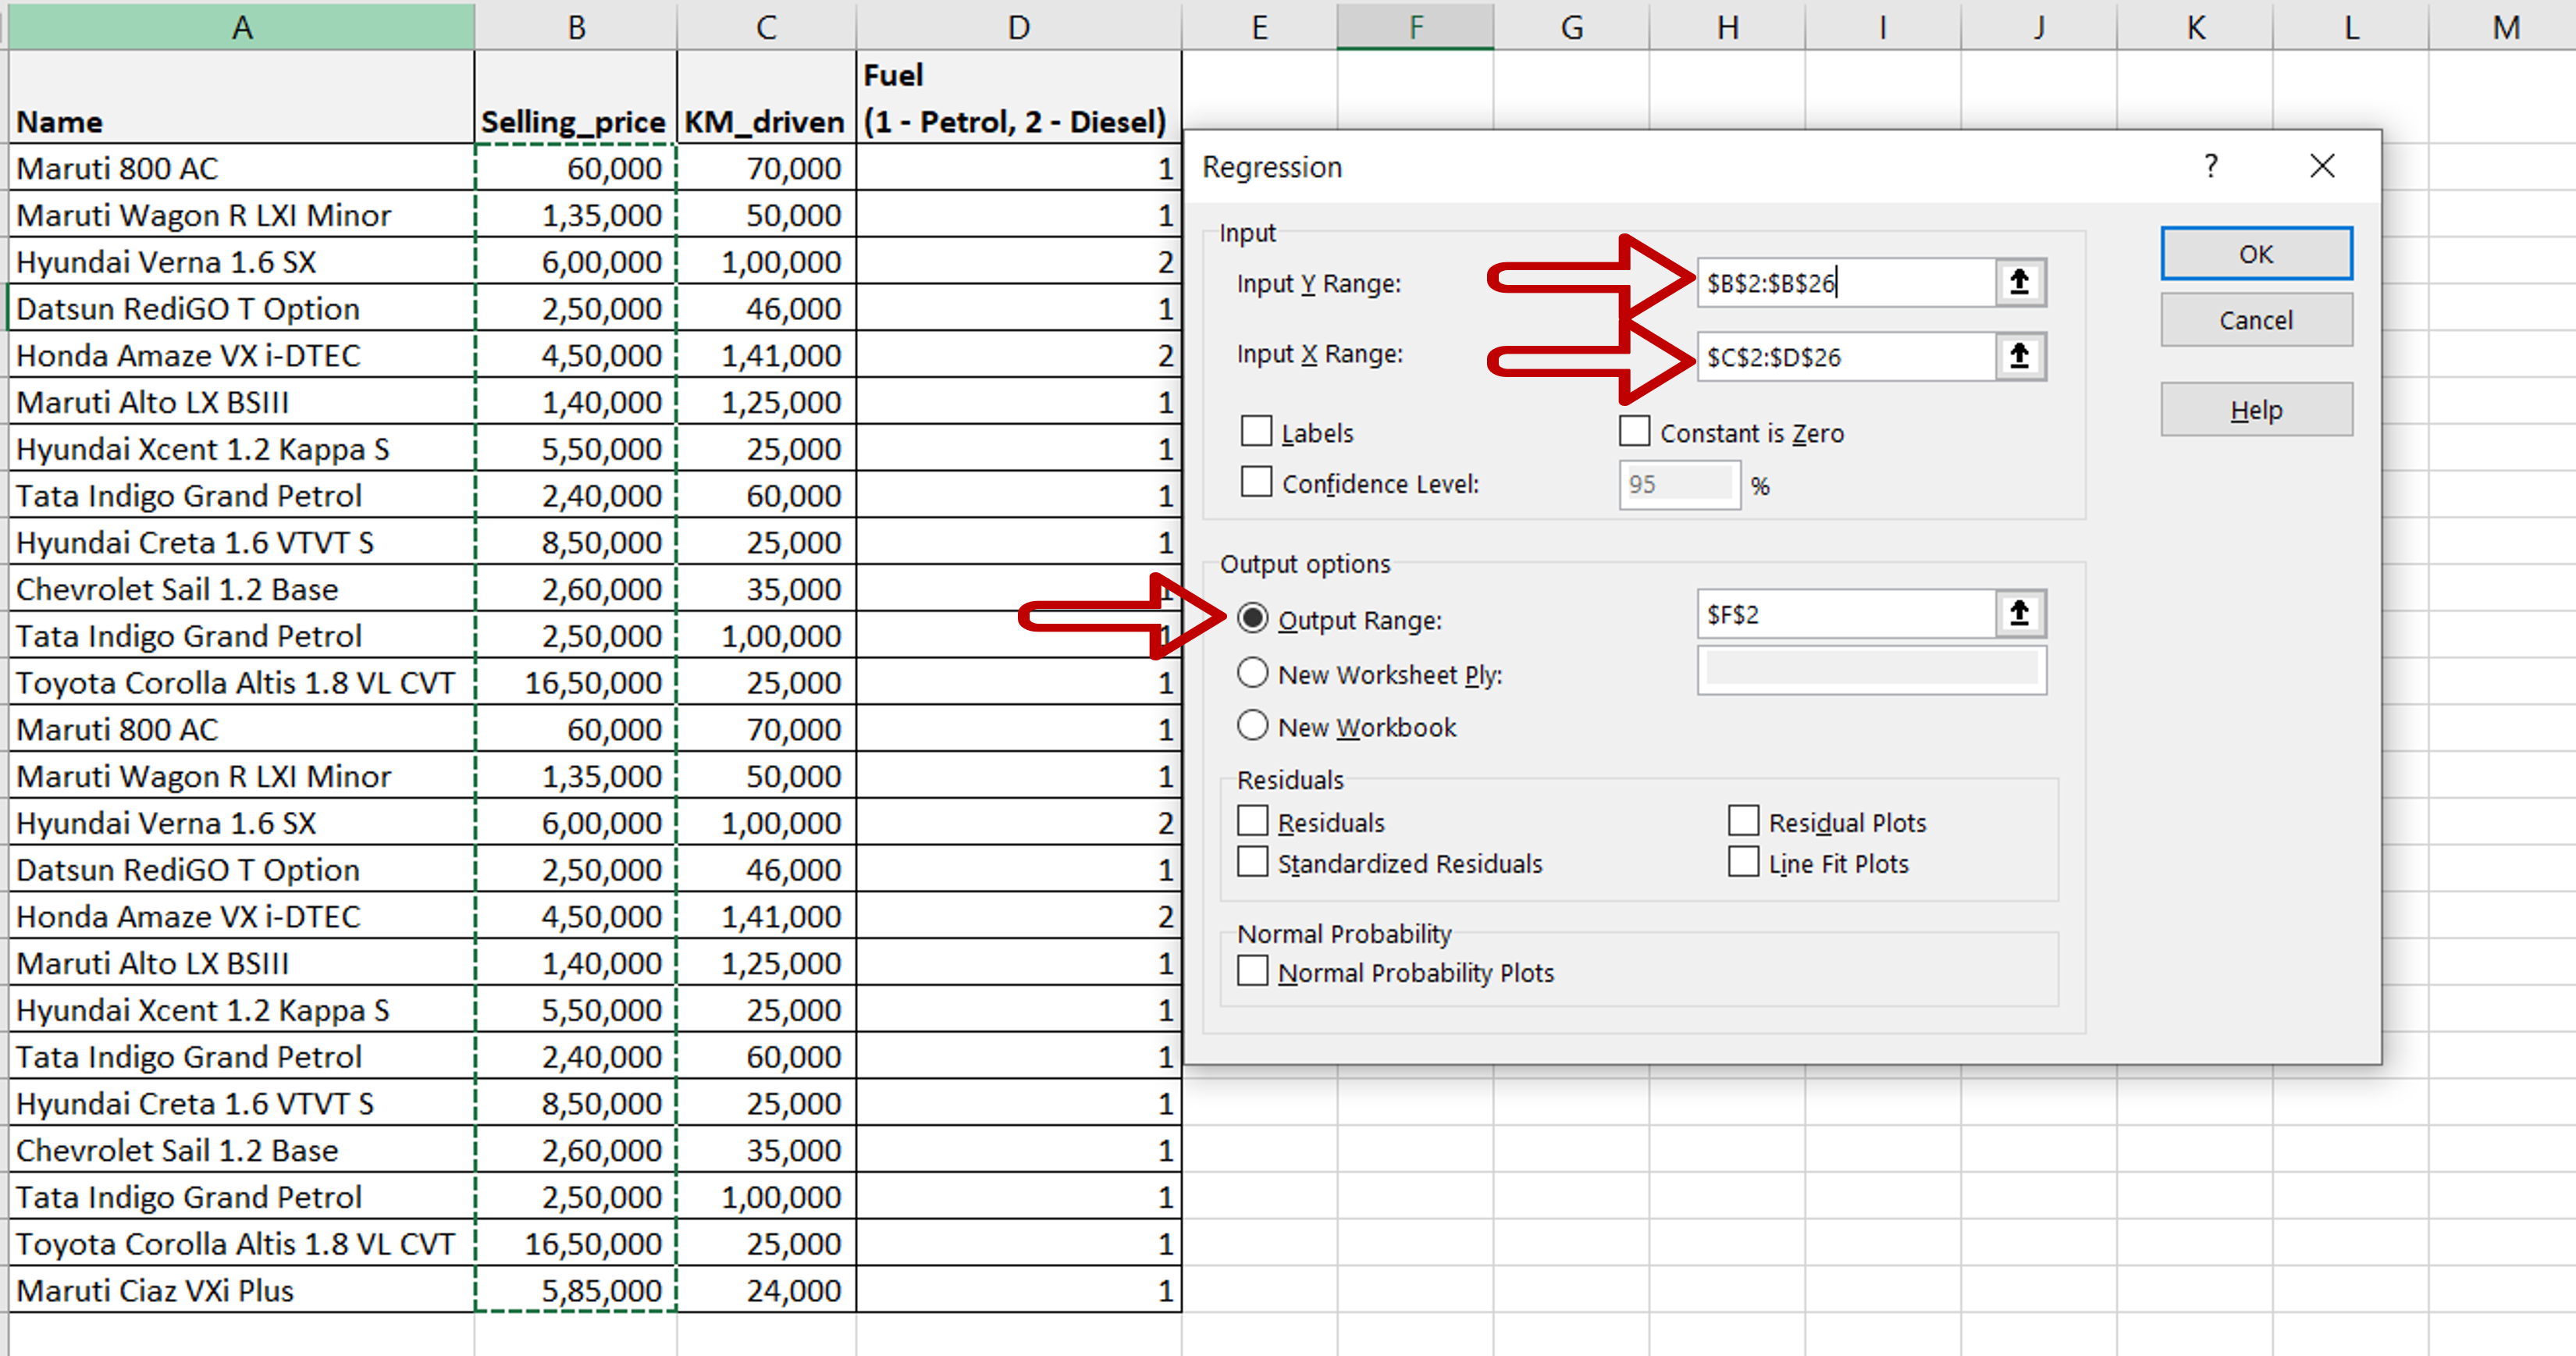
– Define the input ranges:
Input Y Range = the range of the dependent variable i.e. the ‘Selling Price’
Input X Range = and range of the independent variables i.e. ‘KM_driven’ and ‘Fuel’,
– Define the output range i.e where you want the result to be displayed
– Click OK
Step 6 – Check the result
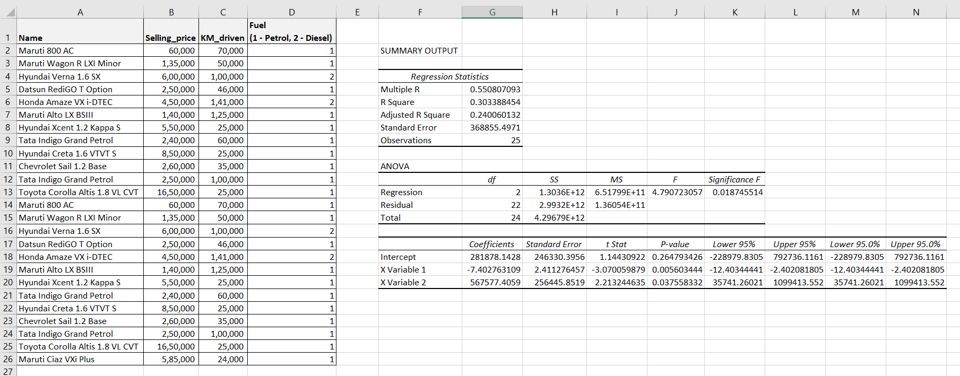
– Multiple linear regression is performed and the results are displayed as SUMMARY OUTPUT


