
How to display an equation on a chart in Excel
 By
SpreadCheaters
By
SpreadCheaters
Page last updated:
16/11/2022 |
Next review date:
16/11/2024
You can watch a video tutorial here.

Excel is widely used for mathematical operations due to the variety of functions and tools it provides. It also provides several charting tools and many types of charts. Having plotted a set of x and y coordinates on a chart, you may want to display the equation on the line.
Step 1 – Open the Format Trendline menu
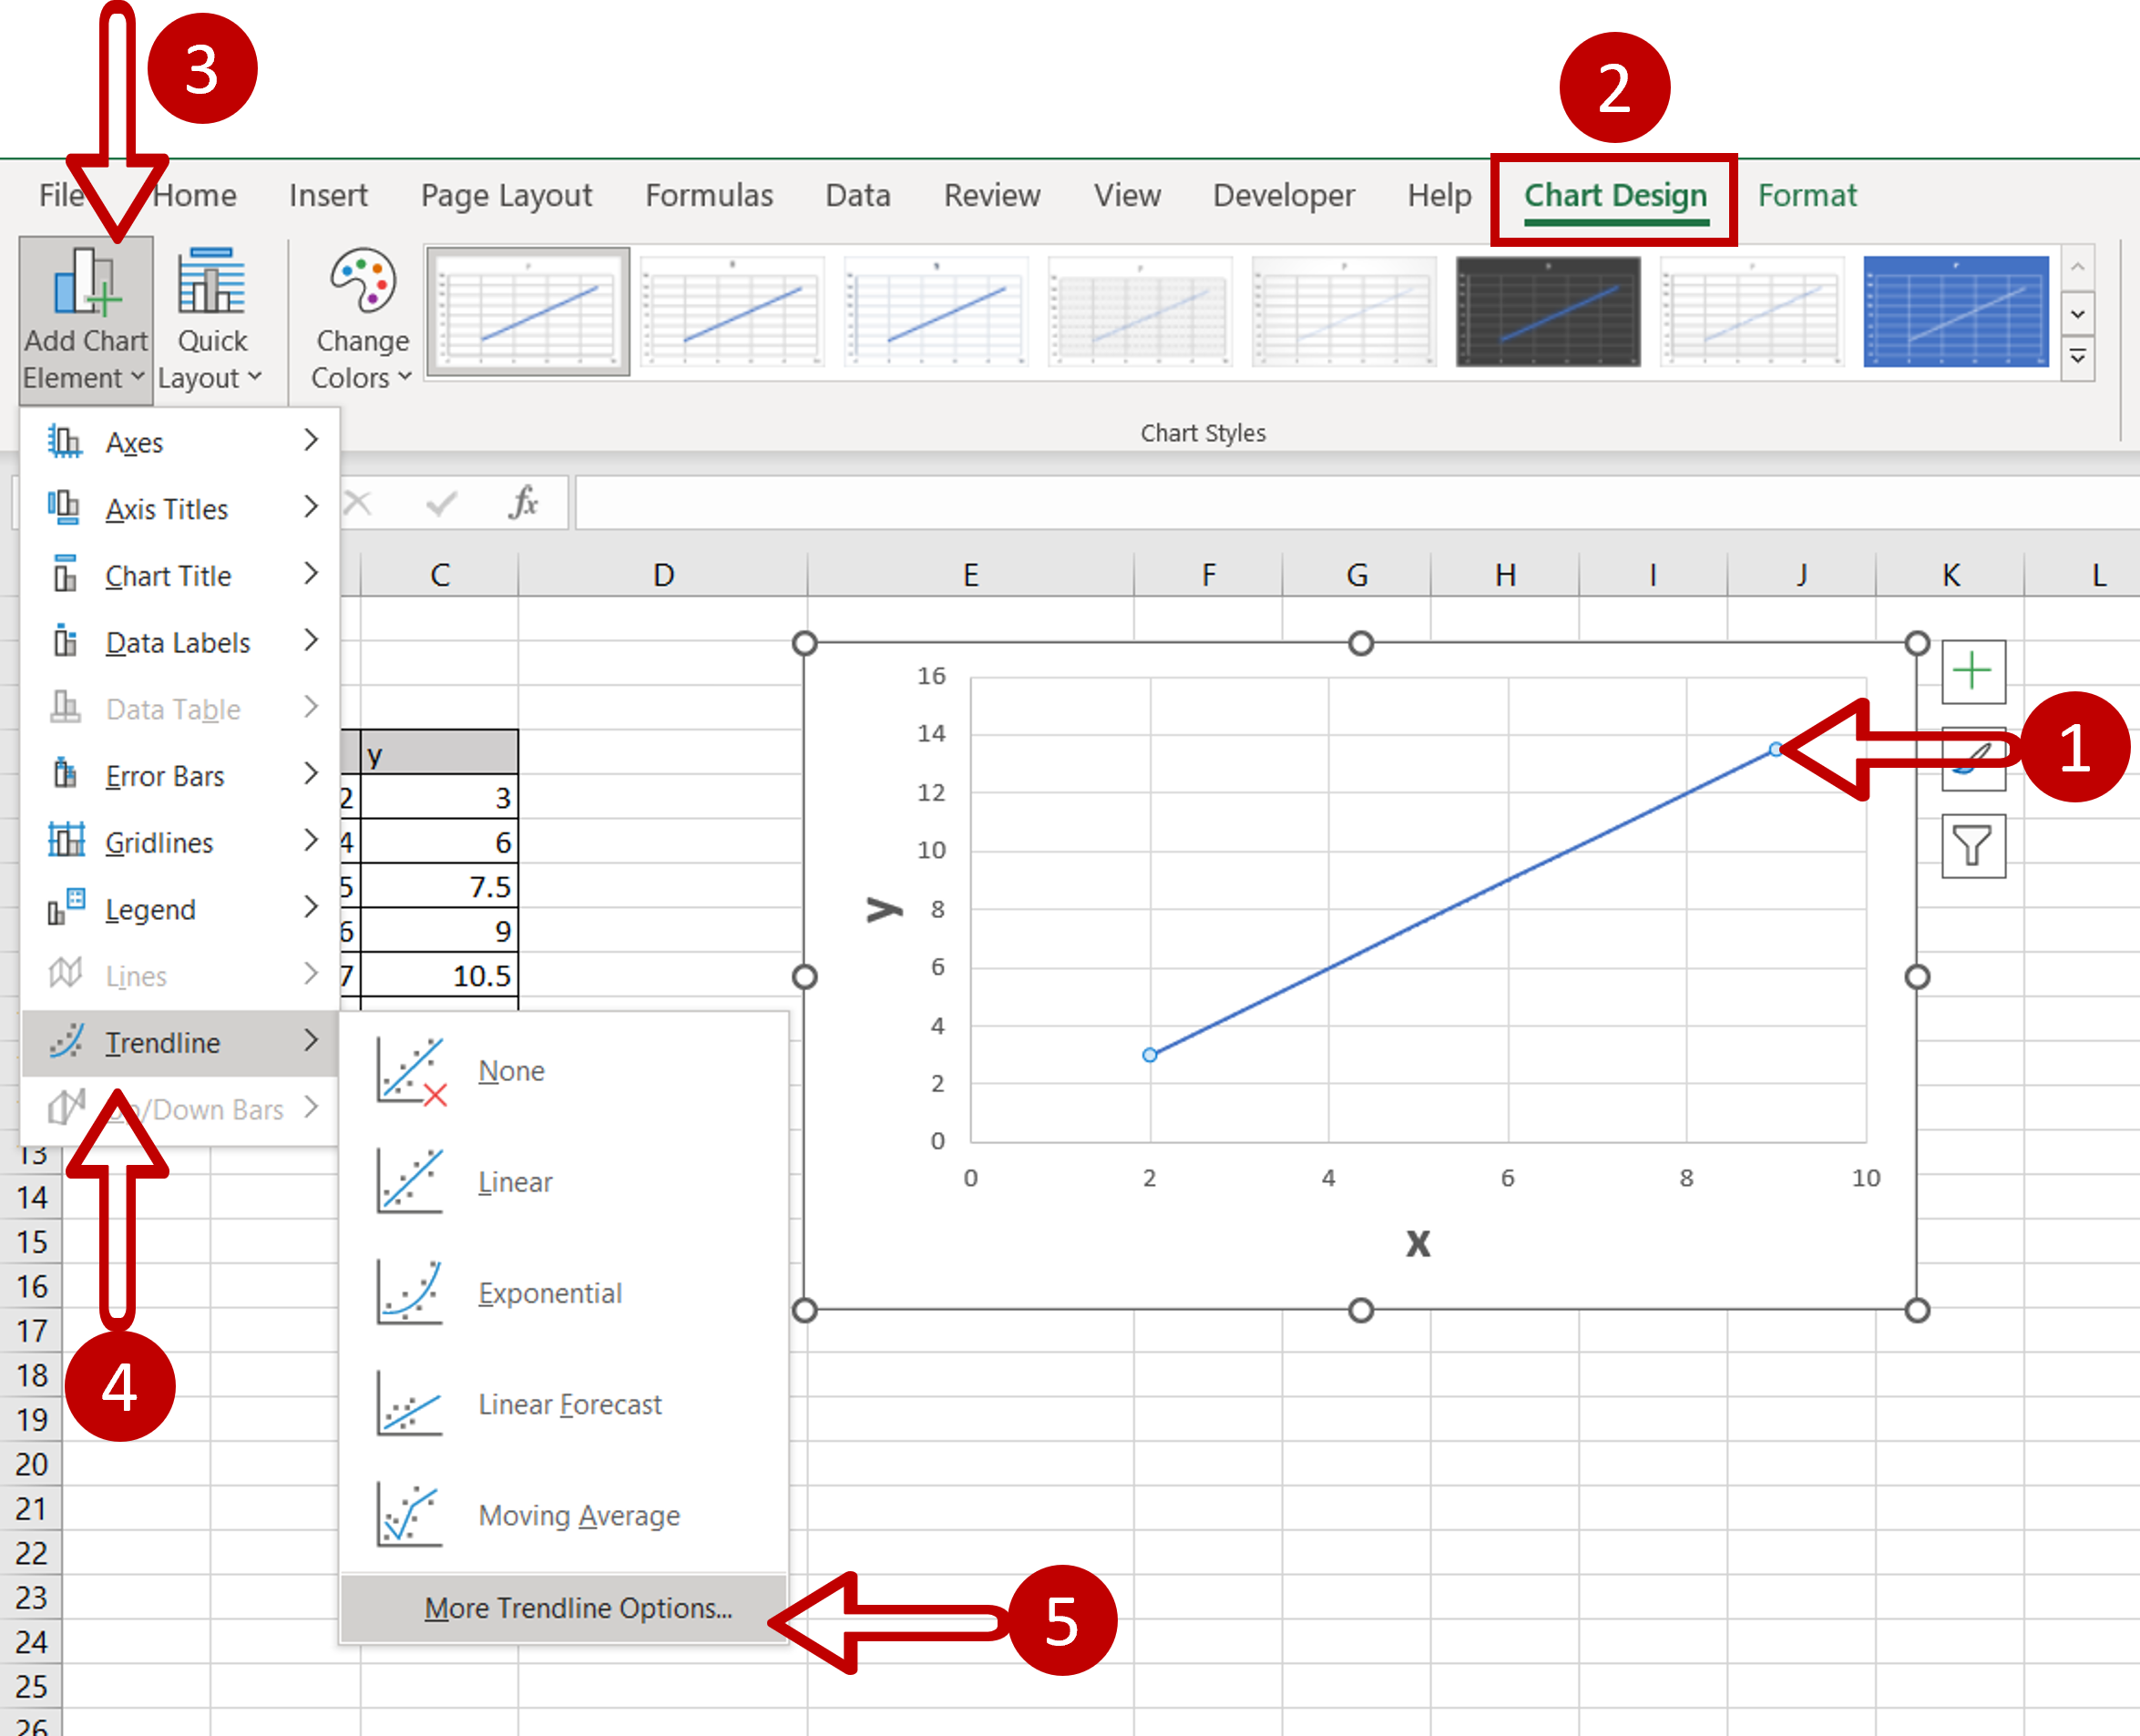
– Select the chart and/or the line
– Go to Chart Design > Add Chart Element > Trendline > More Trendline Options
Step 2 – Select the display option
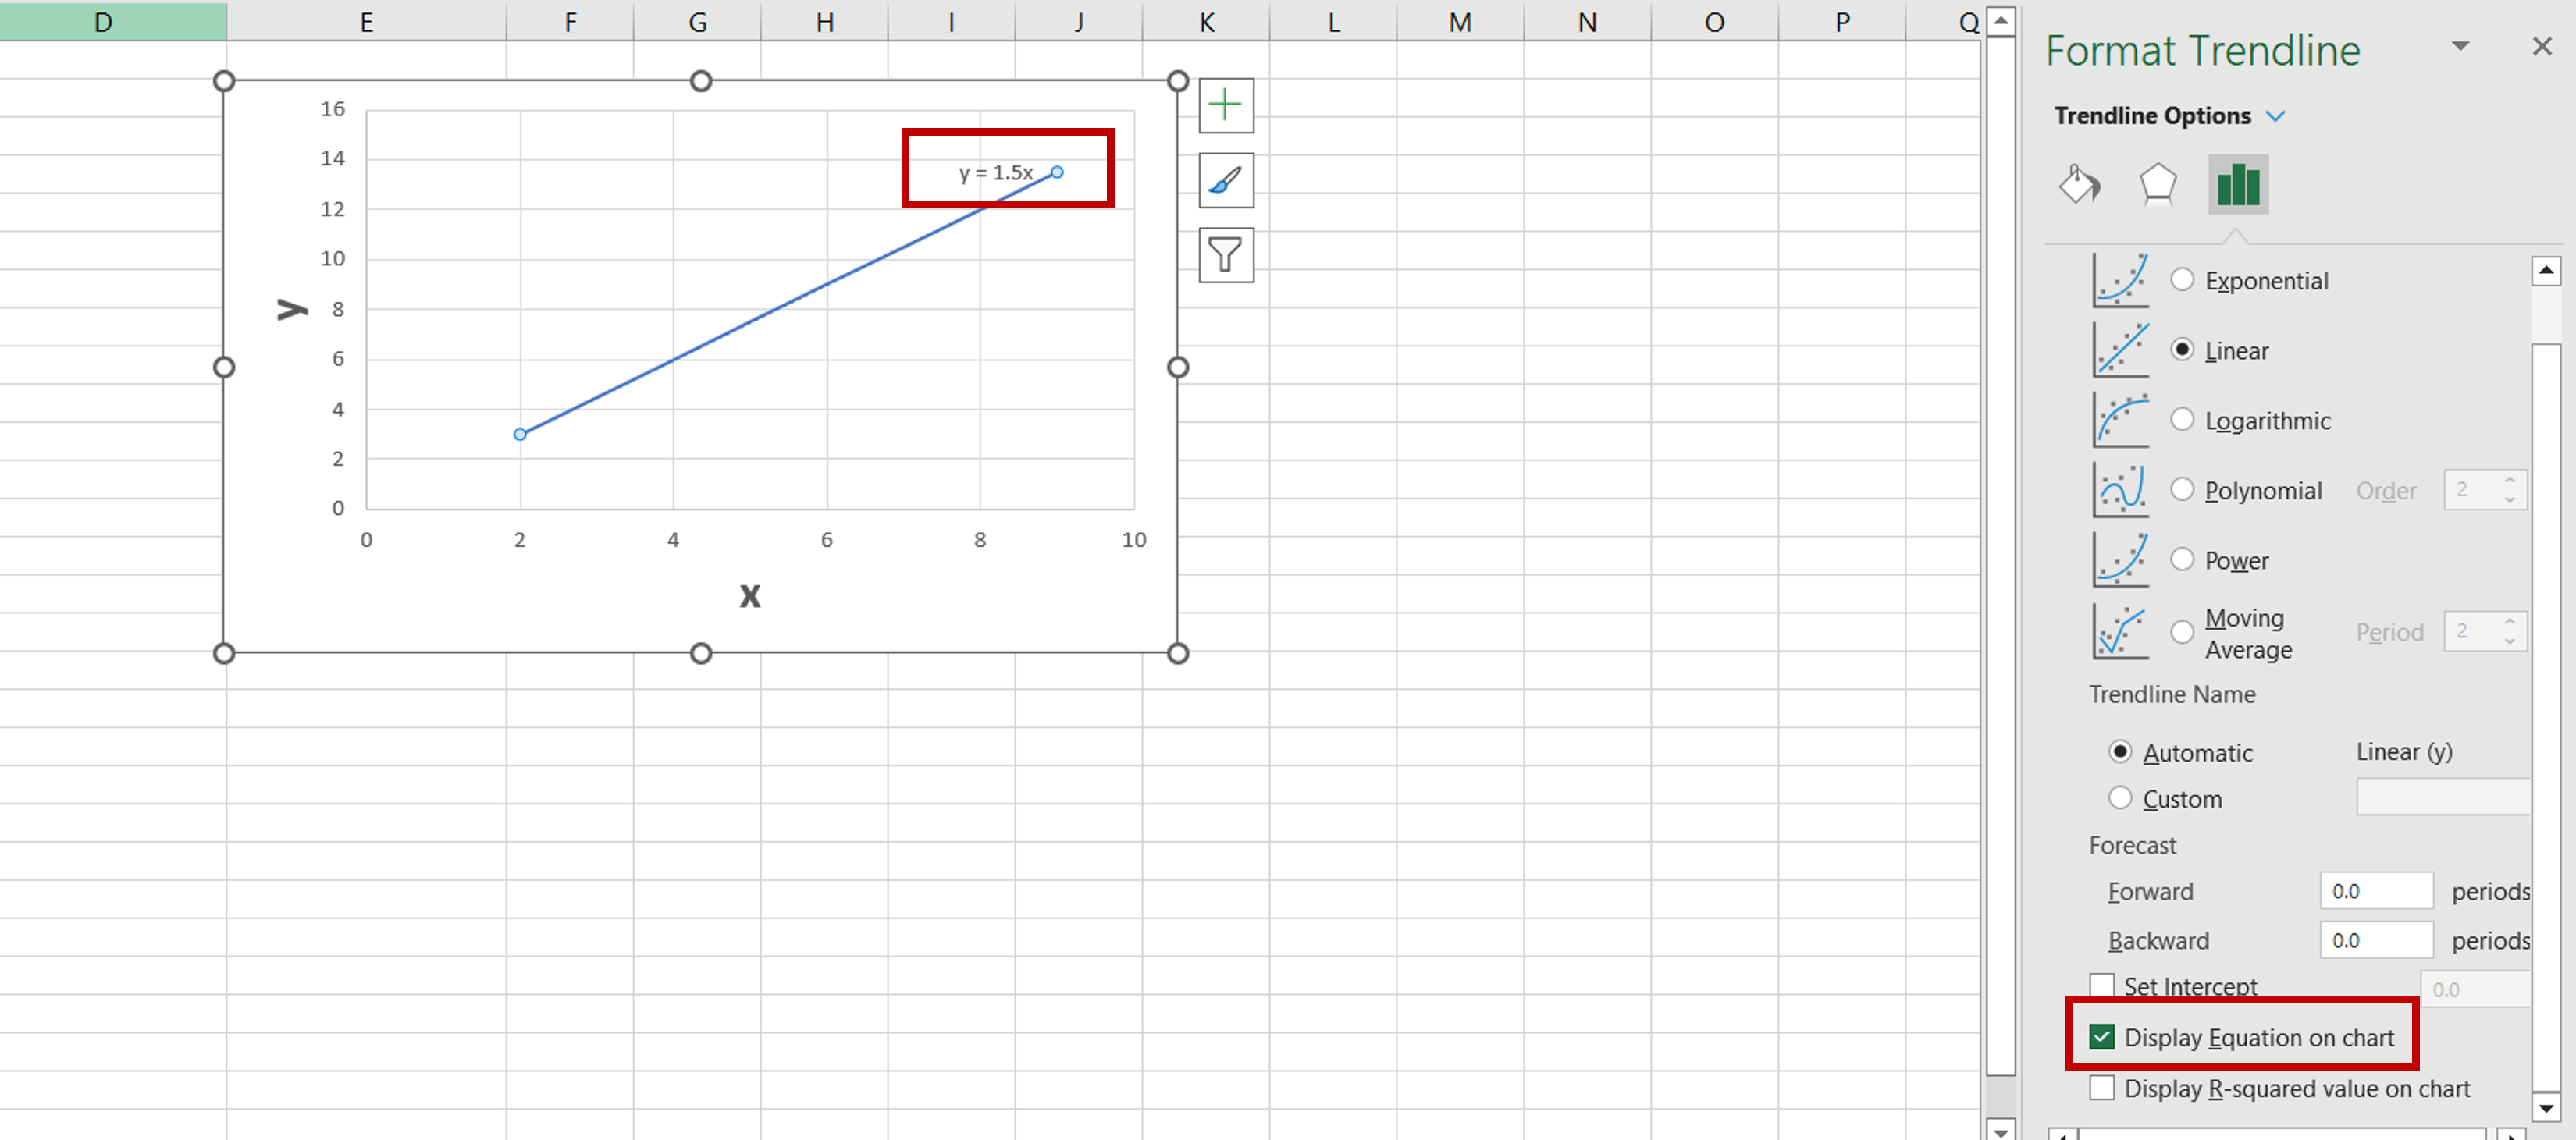
– In the Format Trendline pane, select Display Equation on chart
– The equation will be displayed on the chart


