
How to delete a graph in Excel
 By
SpreadCheaters
By
SpreadCheaters
Page last updated:
23/06/2023 |
Next review date:
23/06/2025
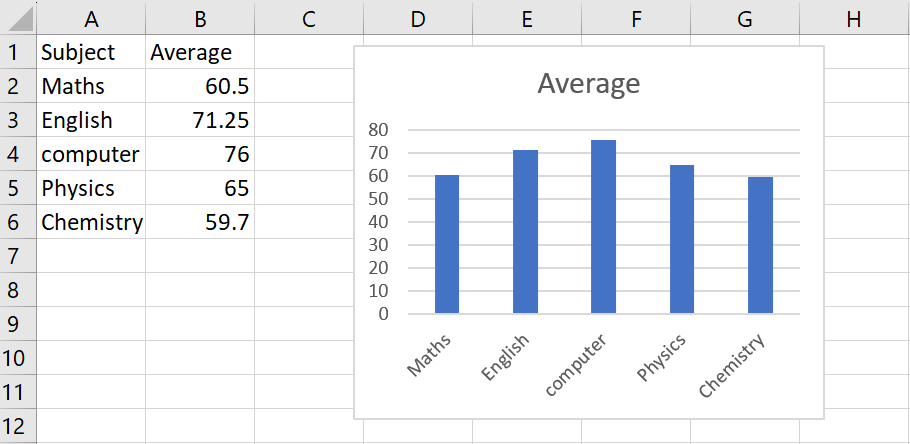
In Excel, deleting a graph means removing a chart or graph object that has been previously created and inserted into the worksheet. This can be done when you no longer need the graph, or if you need to create a new graph with different data.
Our dataset contains the class result with subject names and their respective class averages. A graph is created using this data, but we now need to remove the graph. There are three methods available to delete the graph. the first is by using the Delete key, the second is by using the Clear option, and, the third is by deleting the complete sheet.
Method 1: Delete the graph using the Delete key
Step 1 – Select the graph
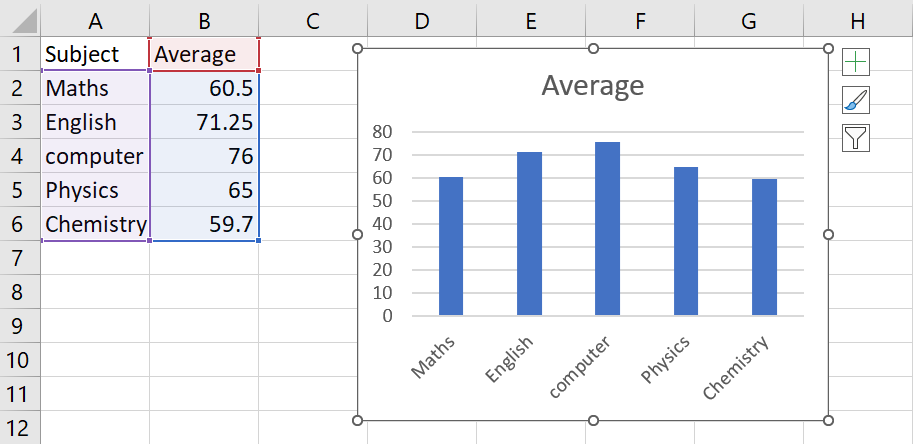
- Click on the graph to select it
Step 2 – Press the Delete key

- After selecting the graph, press the delete key to get the required result
Method 2: Delete the graph using the Clear key
Step 1 – Select the graph

- Click on the graph to select it
Step 2 – Click on the Fill option
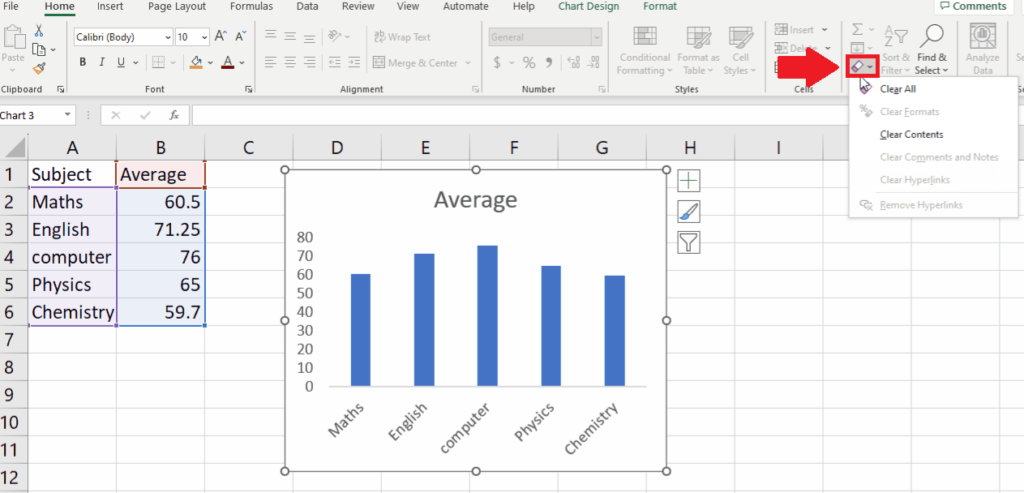
- After selecting the graph, click on the Fill option in the Editing group of the home tab and a drop-down menu will appear
Step 3 – Click on the Clear All option
- In the drop-down menu, click on the Clear All option to get the required result
Method 3: Delete the complete sheet to delete the graph
Step 1 – Click on the File name
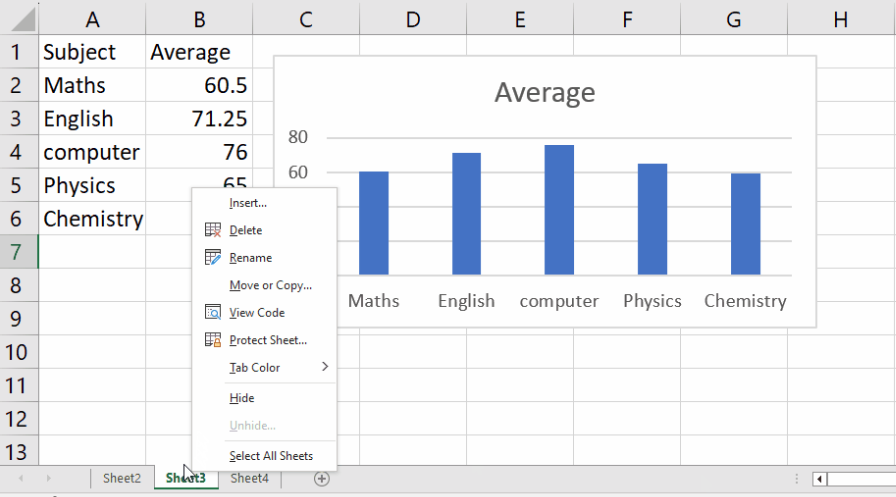
- Click on the file name at the bottom of the sheet and an upside menu will appear
Step 2 – Click on the Delete option
- From the upside menu, click on the delete option to get the required result


