
How to create an organization chart in Excel
 By
SpreadCheaters
By
SpreadCheaters

An Org Chart or Organization Chart is a visual way to explain or understand the relationships between individuals or groups of employees or simply the titles in an organization. Using an organization chart, we can clearly see the organizational hierarchy. It gives us the following information about the organization in a very easy to understand way,
>Which people are in charge of which groups?
>Who is reporting to whom in the organization?
The hierarchy is represented using a row of rectangular boxes (usually known as the ‘Nodes’). Each level of hierarchy is represented on top of the other, which creates a shape almost similar to a pyramid structure.
In this tutorial, we will show you how to create an Org chart from scratch by following these steps.
Step 1 – Locate SmartArt option in Insert Menu
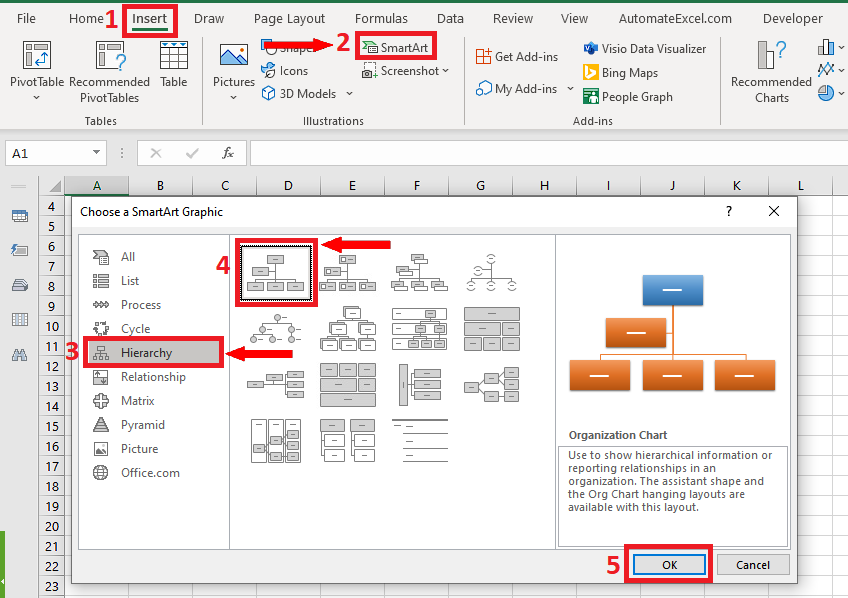
– Go to the Insert Menu on the main tabs.
– Locate the SmartArt option in the Illustrations group.
– Click on the SmartArt option. This will open a new dialog box.
– Choose Hierarchy in Choose a SmartArt Graphics options and select the first type of organizational chart and press OK button.
Step 2 – Locate the boxes to write Titles or Names in organizational chart
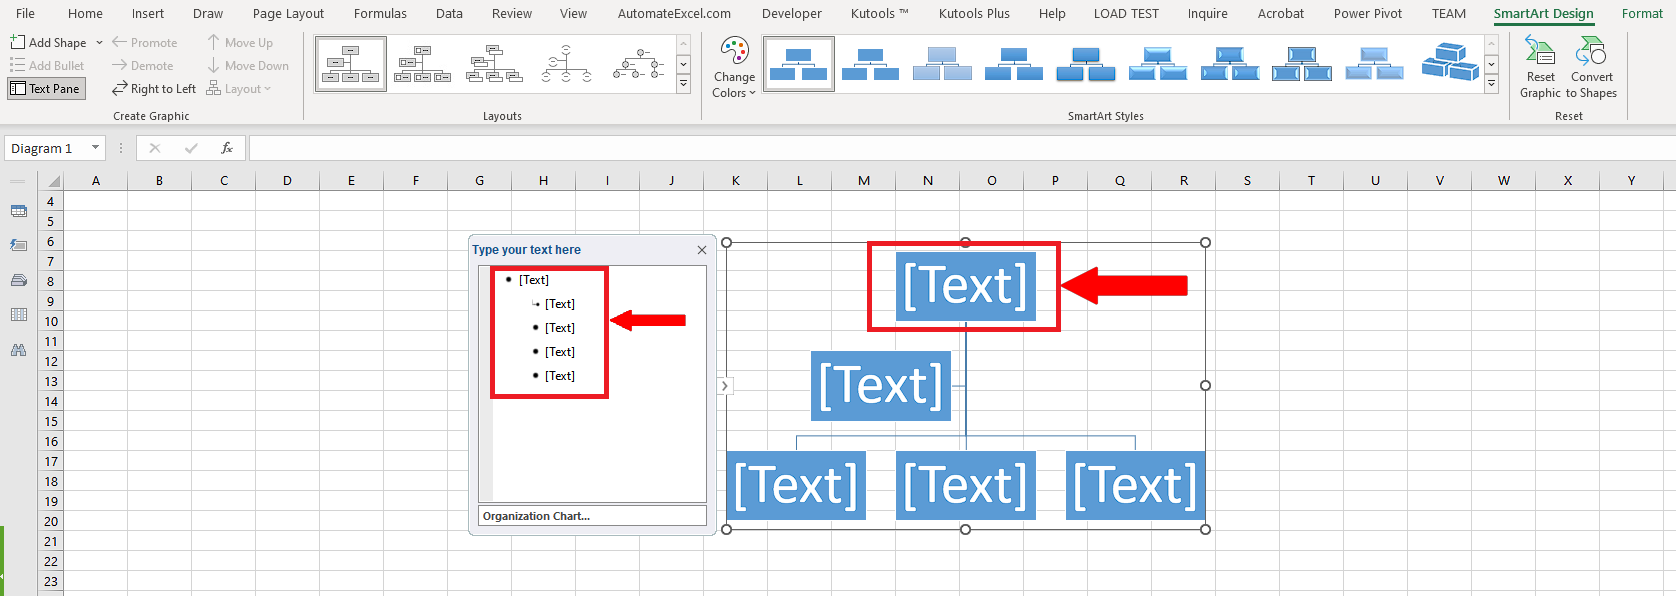
– This will insert a blank organizational chart in Excel spreadsheets and now we can change or add Names or Titles as per requirement in the boxes shown below to create an organizational chart. Click inside the text box or click on the left side menu to enable editing mode.
Step 3 – Write Titles or Names in organizational chart
– Once you are in editing mode, you can write names or titles to create an organizational chart. So, we’ll use CEO, DIR 1, DIR 2 and DIR 3 to create a simple hierarchical chart.
– If you don’t like any box in the chart, you can simply select it and press the delete button to delete the unwanted box. We’ll delete the small box under the first box in our case.
Step 4 – Add new node in existing organizational chart
– Sometimes, we need to add new members to our organizational chart. Let’s add a new Director as DIR4 at the same level as previous Directors. We’ll select the last node in the side menu i.e., DIR3 and simply press enter. This will add a new box in parallel to the other 3 available boxes.
– Write DIR4 to designate it as the 4th Director as shown above.
Step 5 – Add new node using SmartArt Design Options
– We can add the new nodes in the organizational chart by going to the SmartArt Design Tab as well. For this click on the organizational chart and select any node. We’ll select the first node in the chart i.e., DIR1.
– This will enable the SmartArt Design Tab on the list of main tabs. Click on it.
– Go to the Create Graphic group and click on the dropdown menu of Add Shape.
– This will show you the following options;
>Add Shape After
>Add Shape Before
>Add Shape Above
>Add Shape Below
>Add Assistant
– We’ll explore each option and see what happens as shown above.
So, this is how we can create a simple organizational chart in Excel by using SmartArt Graphics.


