
How to create a pivot table with multiple columns
 By
SpreadCheaters
By
SpreadCheaters
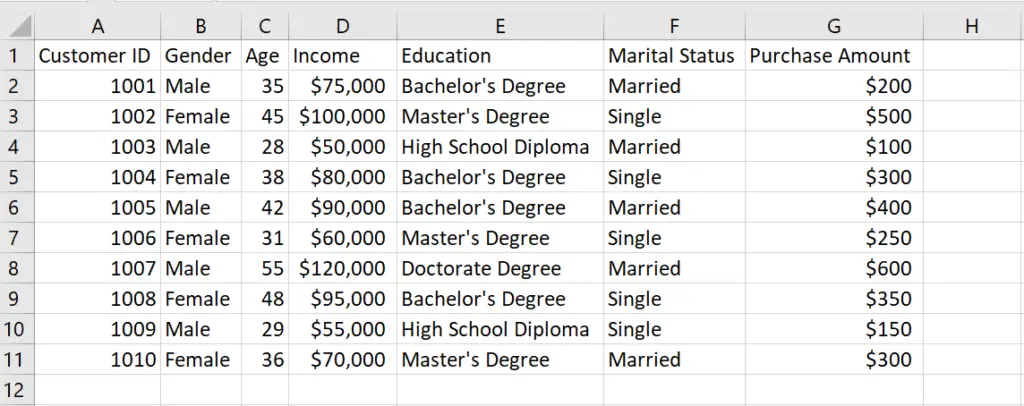
Our dataset consists of information about buyers that a company has gathered to determine its target customers. The data includes the customer ID along with their gender, age, income, marital status, and purchase amount. To better understand this data, we want to create a pivot table with multiple columns. To create a pivot table we will first select our data and then use the Pivot table option.
Creating a pivot table with multiple columns means using more than one column to group and summarize data in a pivot table. The overall importance of creating a pivot table with multiple columns is that it allows you to quickly and easily analyze large amounts of data and draw meaningful insights from it. By grouping and summarizing data in different ways, you can identify trends, patterns, and relationships that might not be immediately apparent from the raw data.
Step 1 – select the range of cells
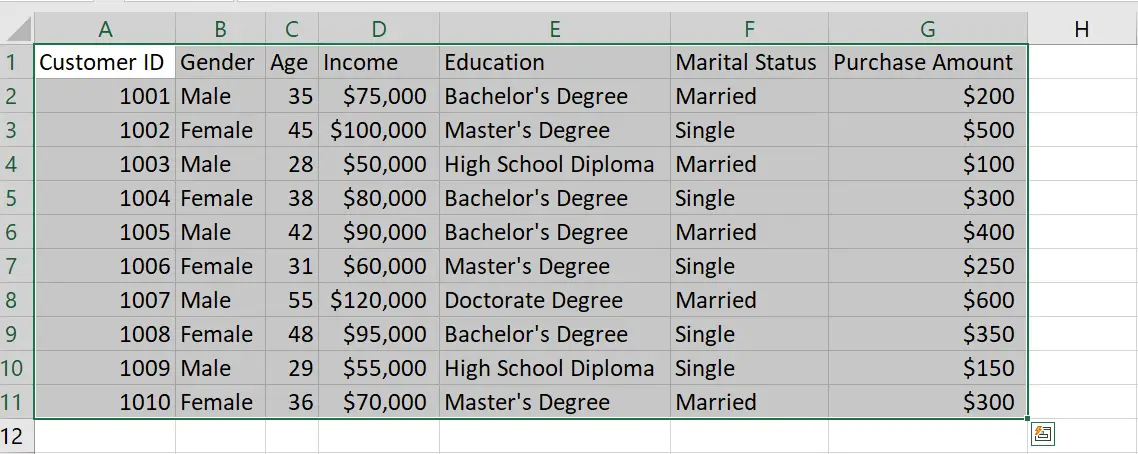
– Select the range of cells using which you want to form the pivot table
Step 2 – Click on the Pivot table option
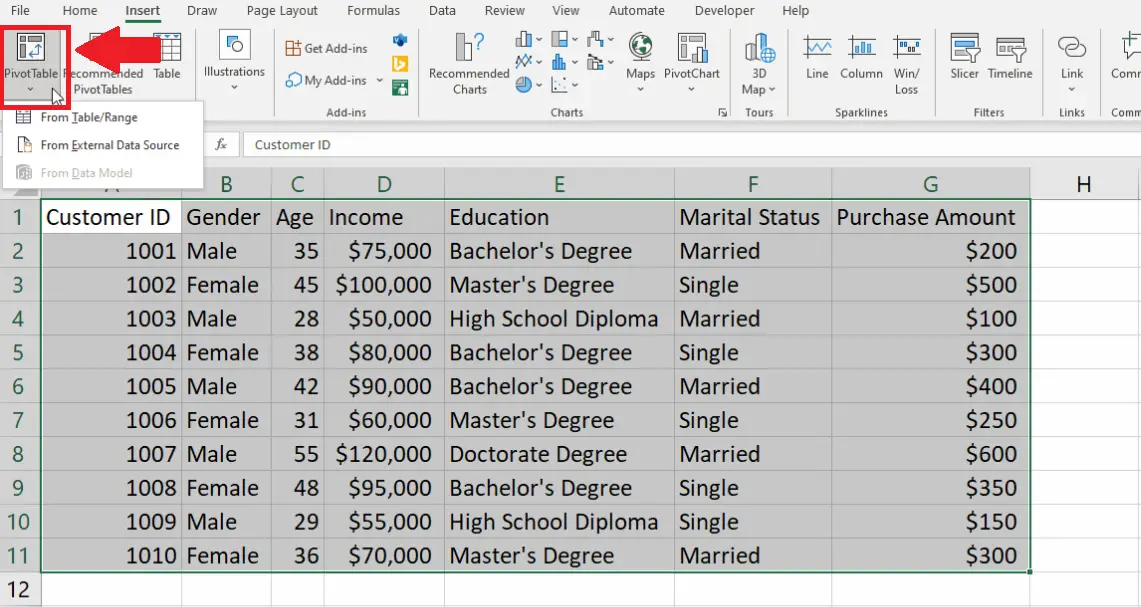
– After selecting the range of cells, click on the Pivot table option in the Tables group of the Insert tab and a drop-down menu will appear
Step 3 – Click on the From Table/Range option
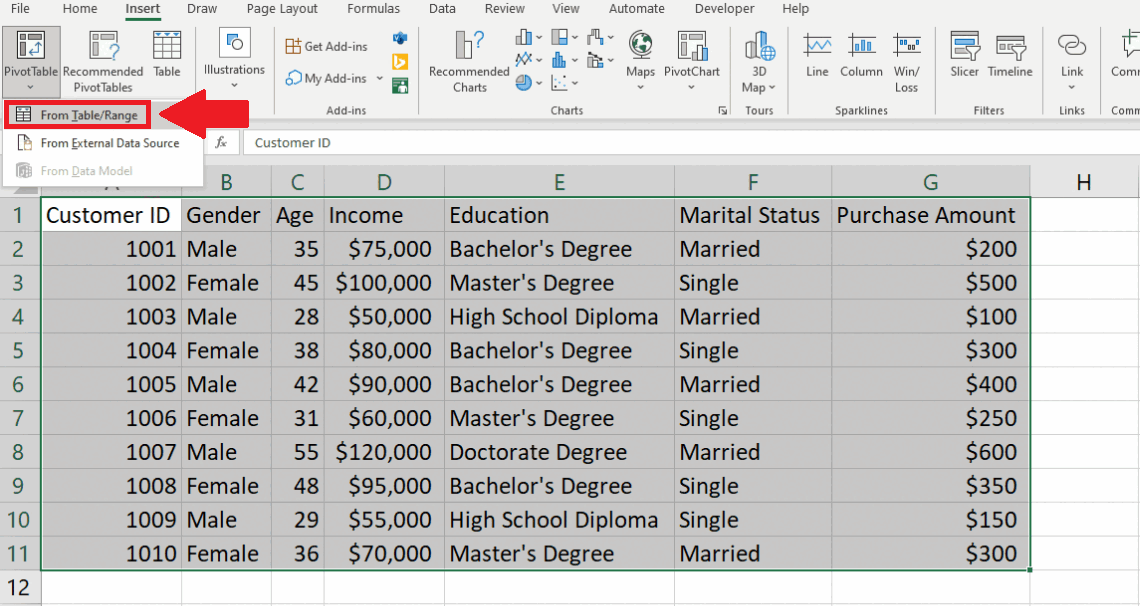
– From the drop-down menu, click on the From Table/Range option and a dialog box will appear
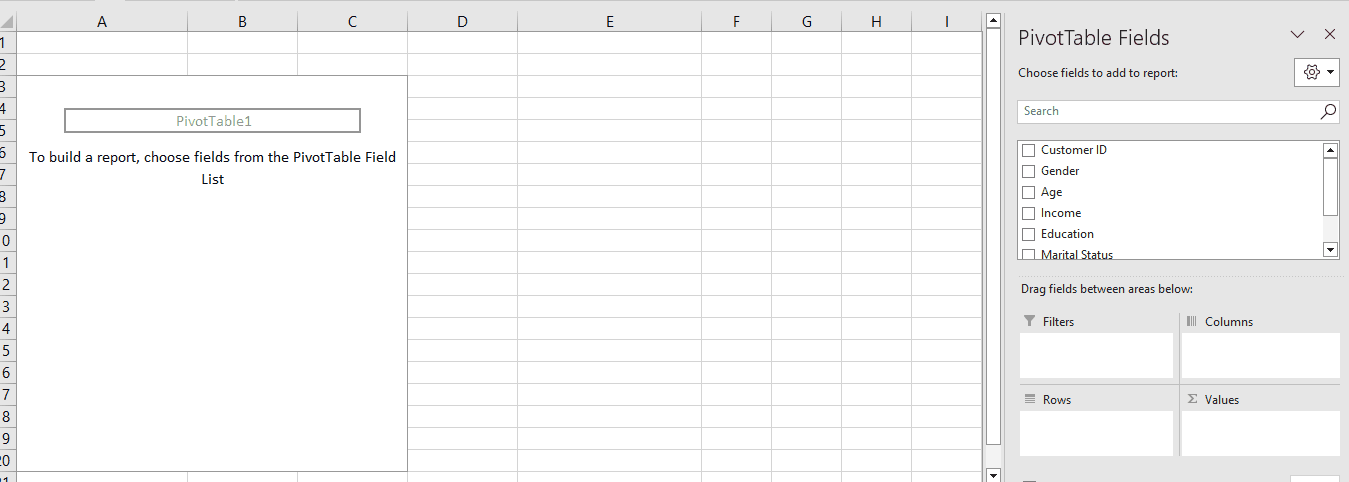
Step 4 – Click on the New Sheet option
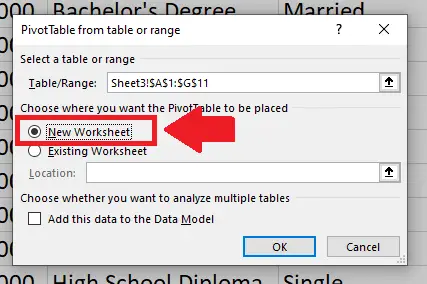
– In the dialog box, click on the check box behind the New Sheet option
Step 5 – Click on OK

– After clicking on the check box, click on OK and a pivot table option will appear on a new sheet
Step 6 – Select the Fields to show
– In the dialog box that will appear on the new page, select the fields you want to show in the pivot table, and the PivotTable with multiple columns will appear
– Here we have selected all the fields


