
How to count distinct values of Pivot Table in Excel
 By
SpreadCheaters
By
SpreadCheaters
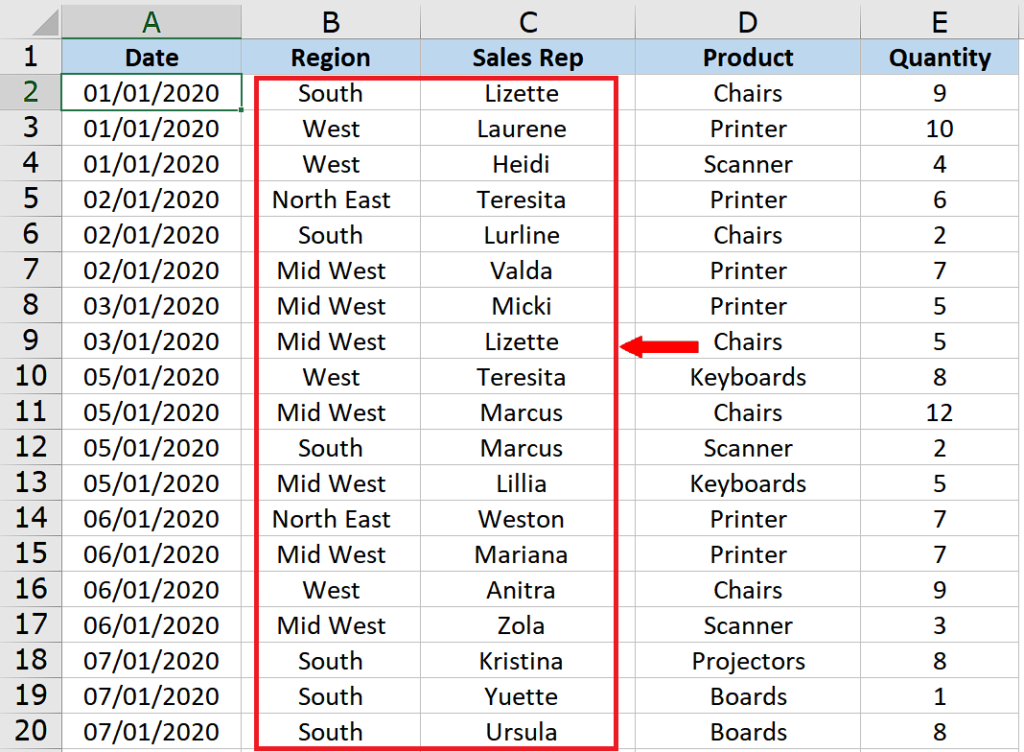
In this tutorial we’ll learn how to count distinct range of data after creation of Pivot Table in Excel, by following the steps below. Let’s look at the dataset above, we are interested in counting the distinct number of sales reps from each region. Let’s follow the steps below to do it.
Excel has a very powerful feature of creating Pivot Tables from the raw data in a spreadsheet. If you have very basic understanding then with a very little effort, you can get loads of work done in no time. Pivot Tables can help you to do a lot of work with a few clicks. However, there are still some tasks which need some more steps to get it done. One such thing is counting the distinct range of data after creation of the Pivot Table in Excel.
Step 1 – Create a Pivot Table from raw data
– To create a pivot table from the raw data, click on any cell inside the data range.
– Go to the Insert tab and simply click on Pivot Table.
– This will open up a new dialog box and then you will be asked to select a range of data from which you wish to create a pivot table. By default, Excel automatically picks up all the data cells. However, you can change the range as per your requirements.
– The most important step here is to check the “Add this data to the Data Model” checkbox. This option will help us in later steps to count the distinct values.
Step 2 – Choose required parameters of pivot table
– As we wish to calculate the distinct number of sales reps with respect to the regions, we’ll add these two parameters to the pivot table. For this purpose, drag Region to Row area.
– Drag the Sales Rep to the Values area. This will create a data table as shown above.
Step 3 – Choose Value Field Settings from pivot table context menu
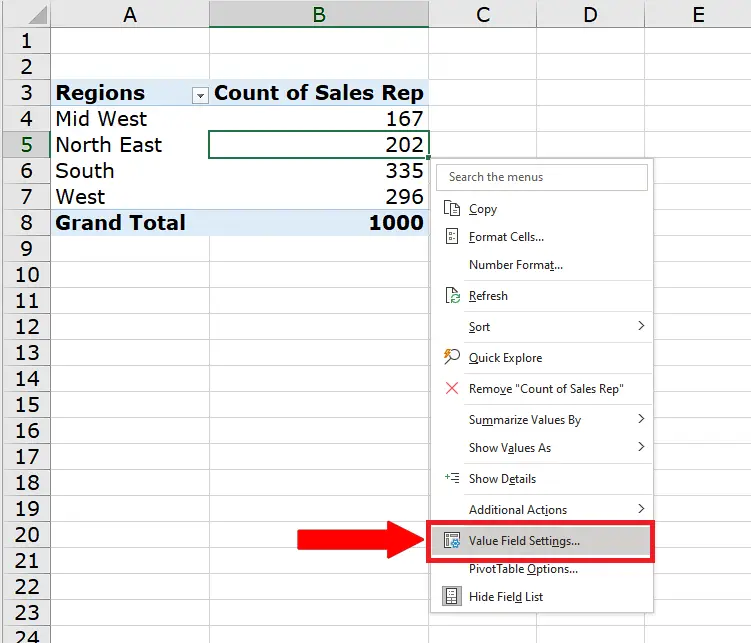
– Right click on any cell in the pivot table.
– This will open up the pivot table context menu.
– Choose Value Field Settings from this context menu.
Step 4 – Select Distinct count option from Value Field Settings options
– The last step will open up a Value Field Settings dialog box.
– Locate Distinct count in Summarize value field by options and select it.
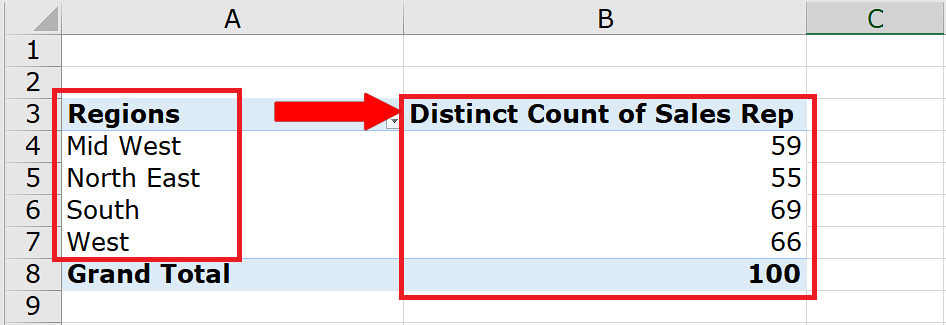
– Press OK to count distinct values. This will automatically calculate the number of distinct sales reps in each region and show us the desired results as shown above.


