
How to copy a chart from Excel to PowerPoint
 By
SpreadCheaters
By
SpreadCheaters
Page last updated:
17/06/2023 |
Next review date:
17/06/2025
Copying a chart from Excel to PowerPoint means that you are taking a chart or graph that you have created in Microsoft Excel and pasting it into a Microsoft PowerPoint presentation. This is a common way to present data or visualizations in a professional setting.
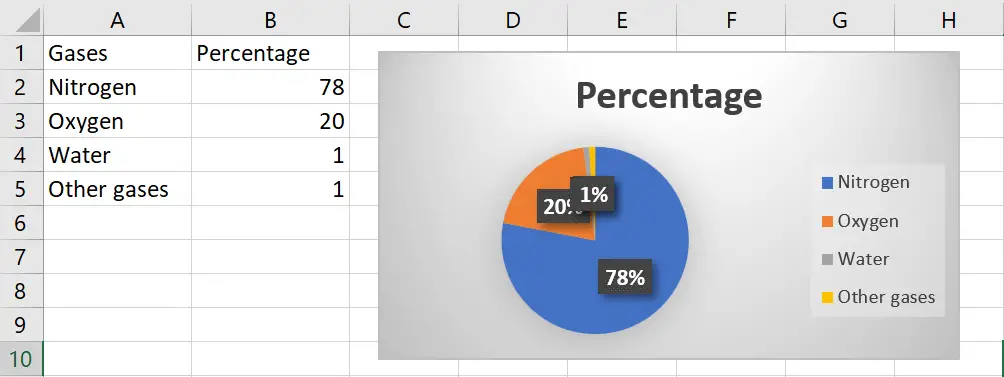
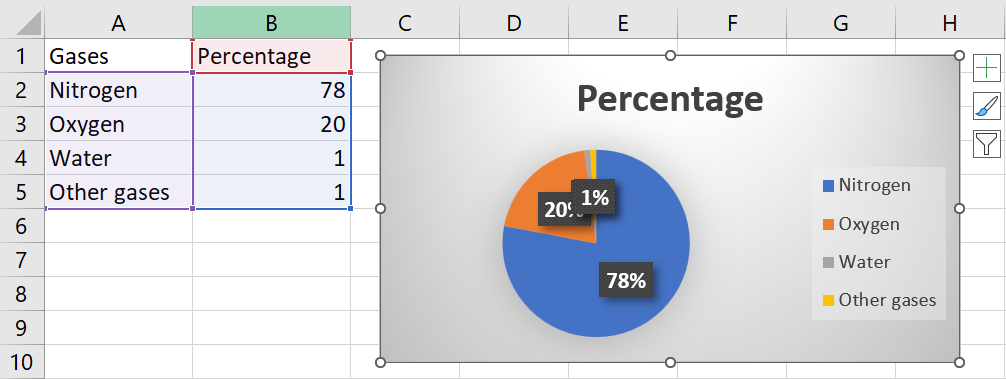
Our dataset contains a graphical representation of the composition of air in the atmosphere, which is currently in the form of an Excel graph. We need to transfer this graph to a presentation in PowerPoint. There are three ways to do this – using the taskbar, keyboard shortcuts, or the context menu.
Method 1: Copy and Paste the graph using the clipboard options
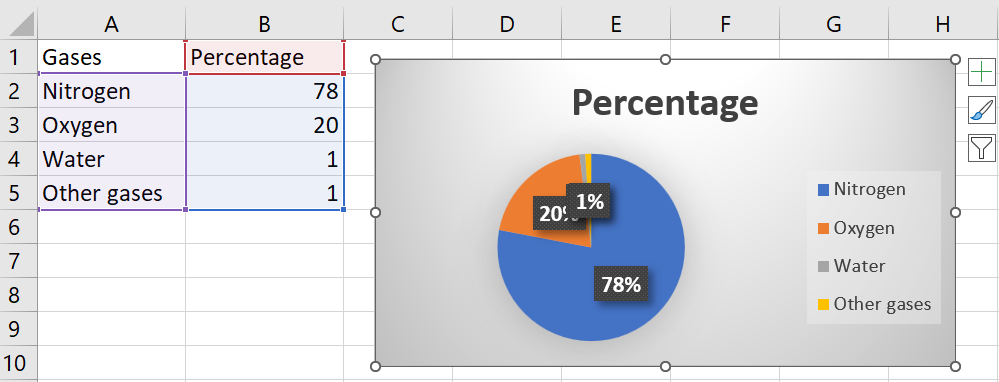
Step 1 – Select the Graph

- Click on the graph in Excel to select it
Step 2 – Click on the Copy option
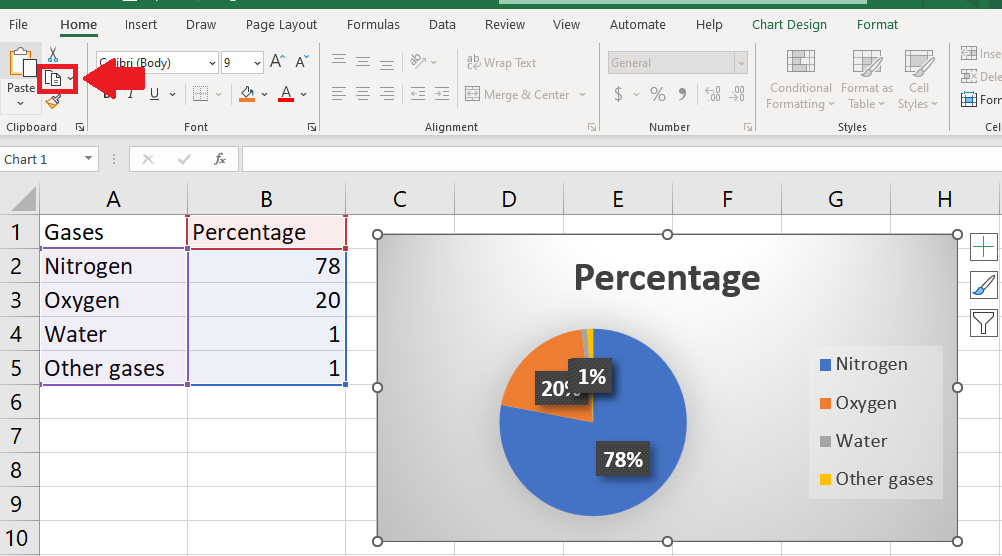
- After selecting the graph, click on the Copy option in the Clipboard group of the Home tab
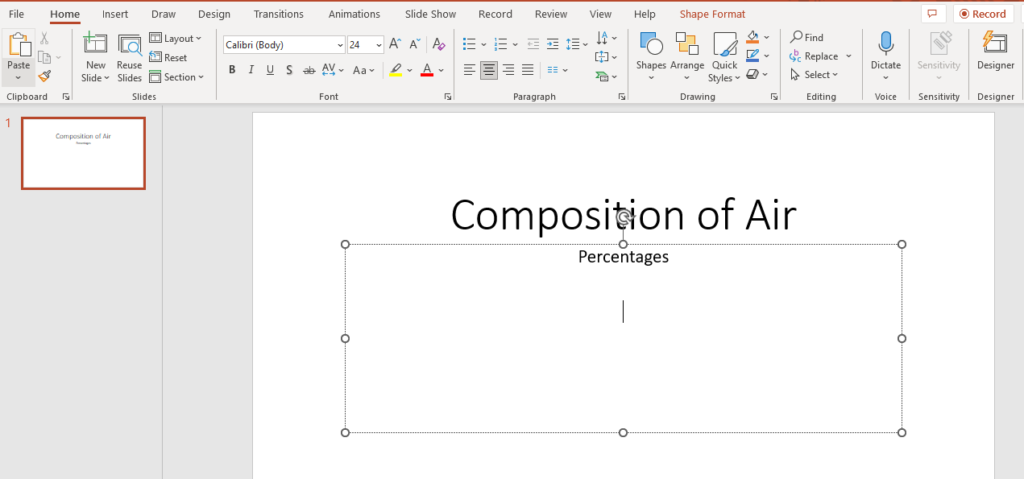
Step 3 – Select the place to Paste

- Right-click on the place where you want to paste the copied graph into PowerPoint
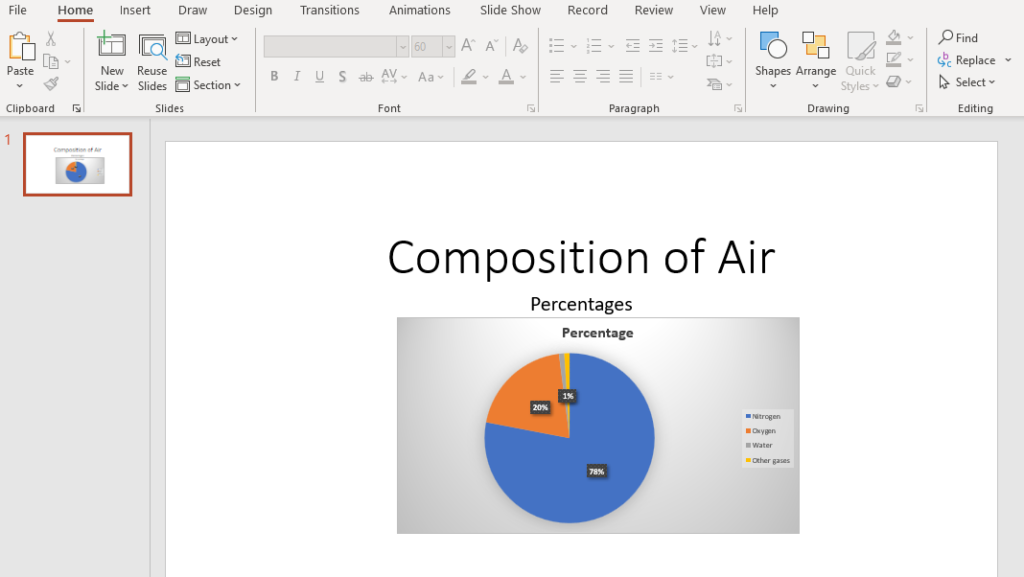
Step 4 – Click on the Paste option
- After selecting the place for pasting, click on the Paste option to get the required result
Method 2: Copy and Paste the Graph by using the Keys
Step 1 – Select the Graph
- Click on the graph in Excel to select it
Step 2 – Press the CTRL+C keys
- After selecting the graph, press the CTRL+C keys to copy the graph
Step 3 – Select the place to Paste
- Right-click on the place where you want to paste the copied graph into PowerPoint
Step 4 – Press the CTRL+V keys
- After selecting the place where you want to paste the graph, press the CTRL+V keys to get the required result
Method 3: Copy and Paste the Graph using the Context menu
Step 1 – Select the Graph

- Click on the graph in Excel to select it
Step 2 – Copy the graph
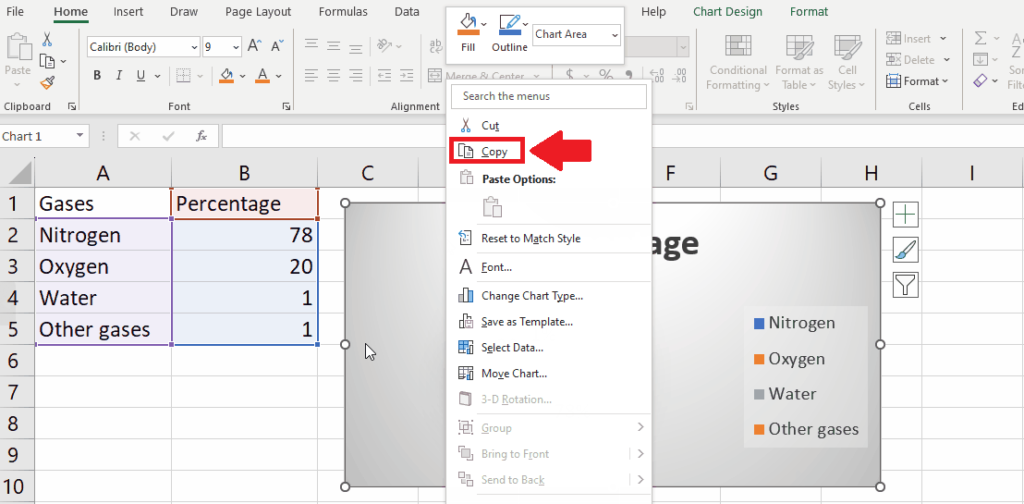
- After selecting the graph, copy it
- To copy, right-click on the graph and a context menu will appear
- From this context menu, click on the Copy option
Step 3 – Select the place to Paste

- Right-click on the place where you want to paste the copied graph into PowerPoint
Step 4 – Paste the Graph
- After selecting the place, right-click on it and a context menu will appear
- From this menu, click on the Paste option to get the required result


