
How to change x and y axes in Excel
 By
SpreadCheaters
By
SpreadCheaters
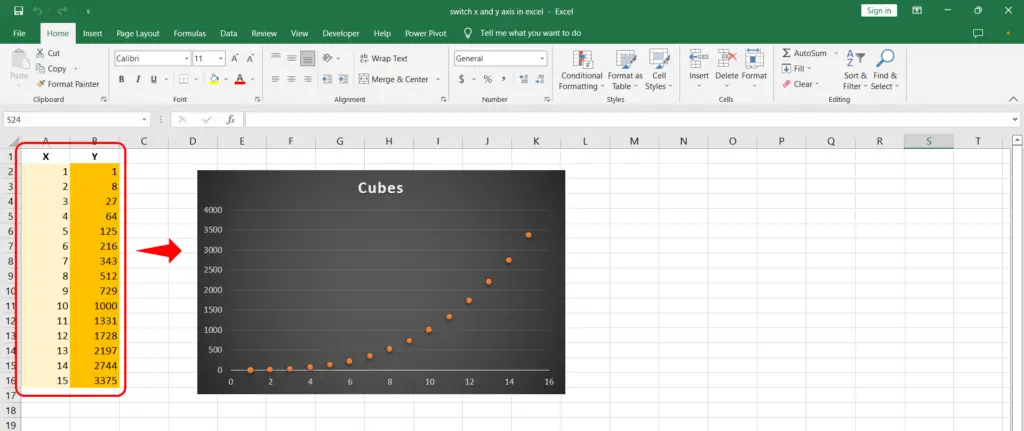
In our dataset we have a series of numbers and its cube values. These are shown above.
With a huge set of plotting tools Excel provides extensive modifying techniques for its chart and graph users. One of such techniques is a way to interchange the x and y axes in a graph. Let’s learn how to do it.
Step 1 – Select Data Source
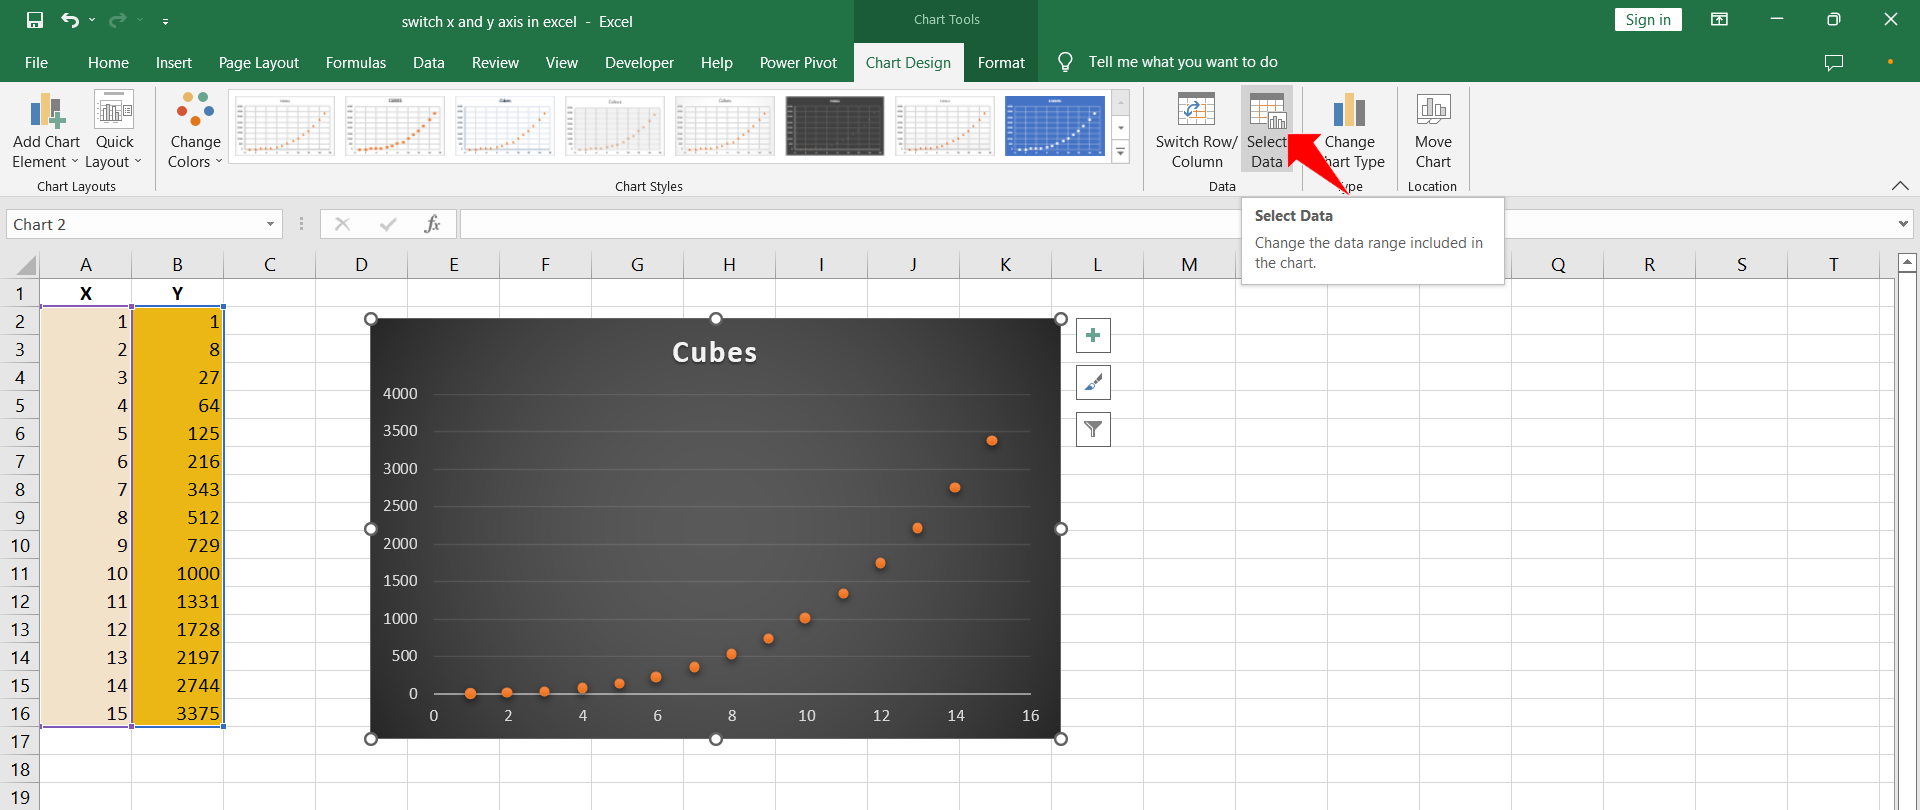
– Go to the Char Design tab in the Chart Tools on the ribbon.
– Click the Select Data button in the Data group.
– The Select Data Source dialog will appear.
Step 2 – Edit Legend Entries
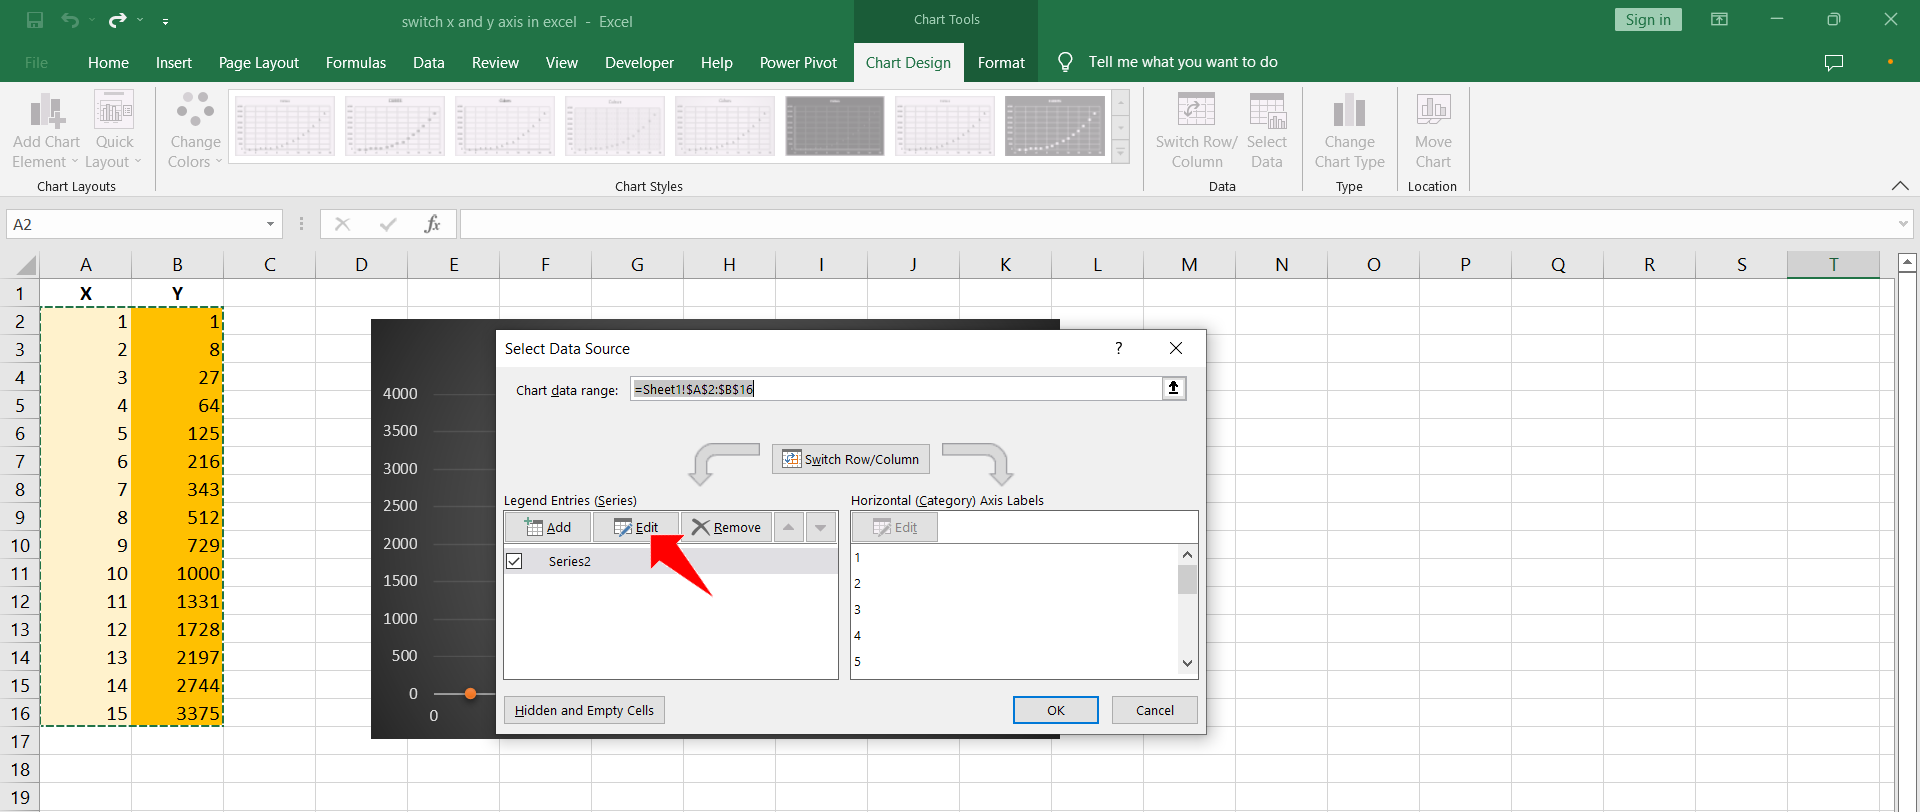
– As a result of Step 1 the Select Data Source dialog will appear.
– Click Edit under the Legend Entries.
– The Edit Series dialog will appear.
Step 3 – Interchange x and y series values
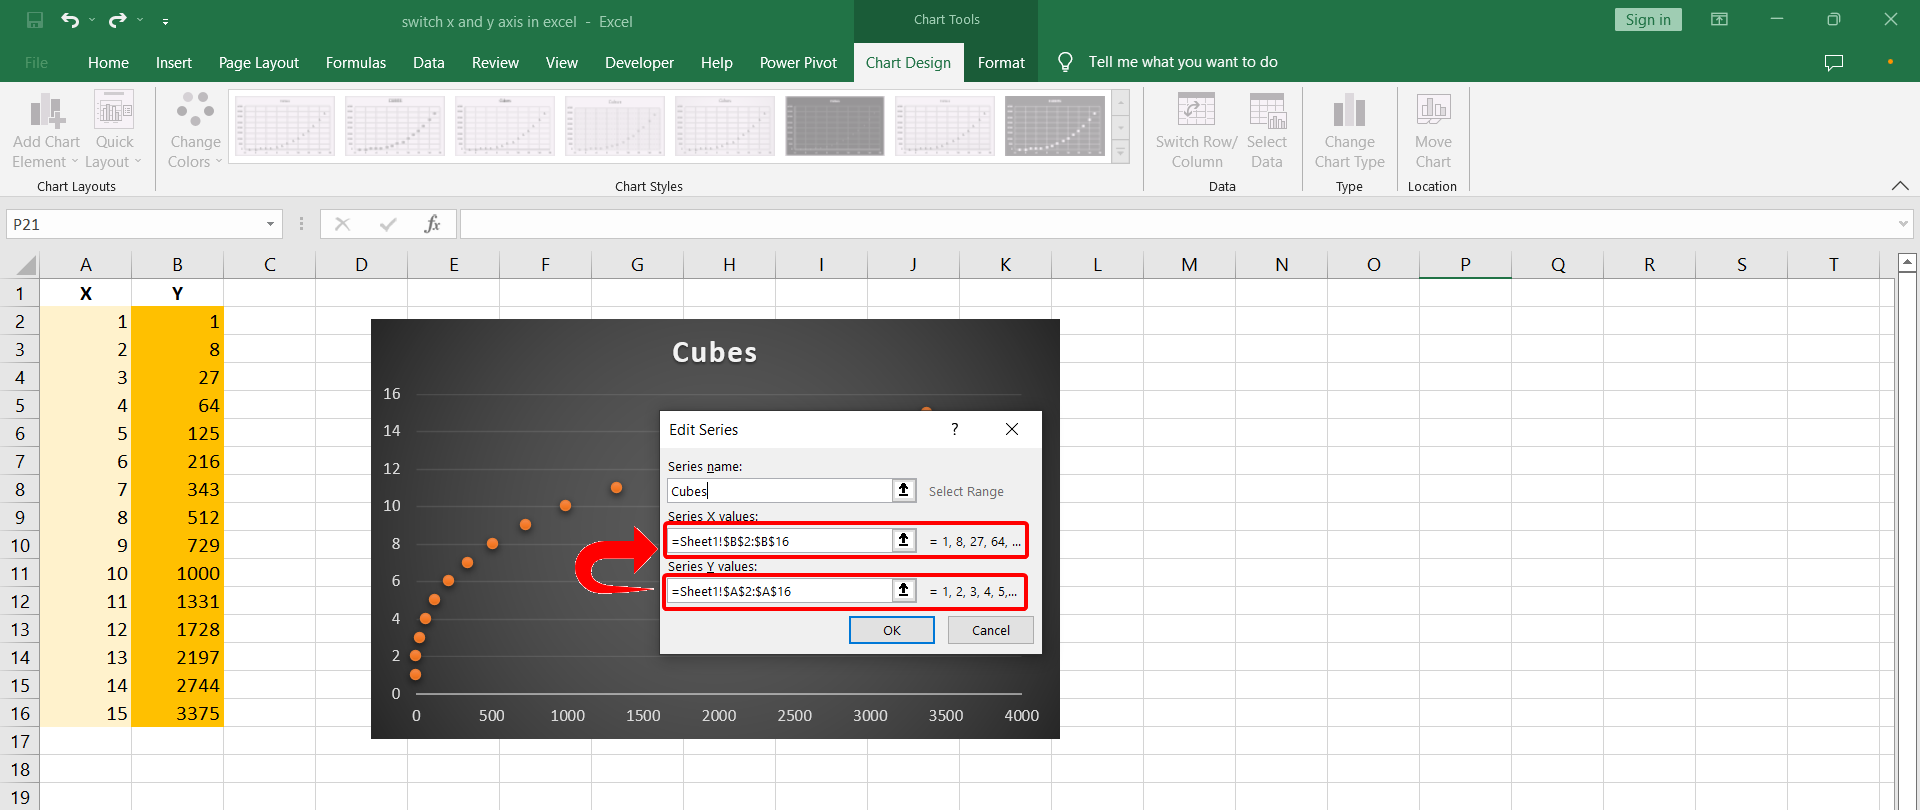
– Interchange the series entries in the Series X and Series Y values.
– Click OK on the Edit Series and dialog as well as the Select Data Source dialog to return to the Chart with X and Y axis interchanged successfully.
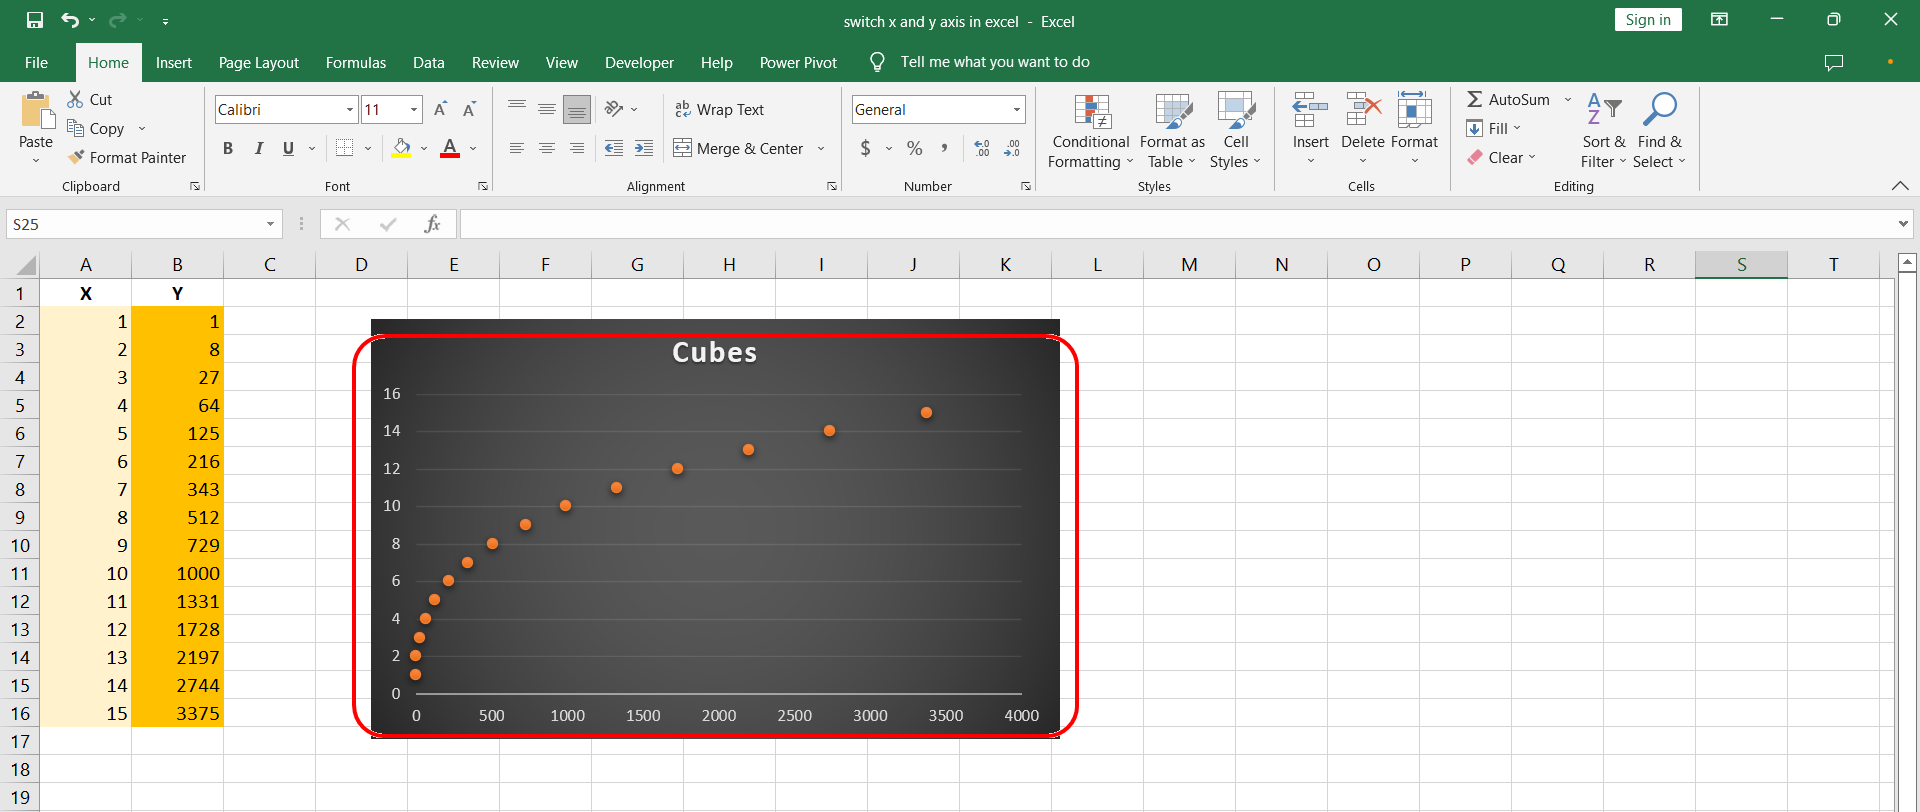
Step 4 – Review the final data

– Finally after pressing the OK button on the last dialog box. You will get the chart in which the x and y axes are interchanged with each other.


