
How to change the pivot table range
 By
SpreadCheaters
By
SpreadCheaters
Page last updated:
16/11/2022 |
Next review date:
16/11/2024
You can watch a video tutorial here.
Pivot tables are one of the most useful tools in Excel for summarizing and analyzing data. After creating a pivot table from a dataset, the dataset may increase in size and you will have to change the range of the pivot table.
Step 1 – Open the Change Data Source window
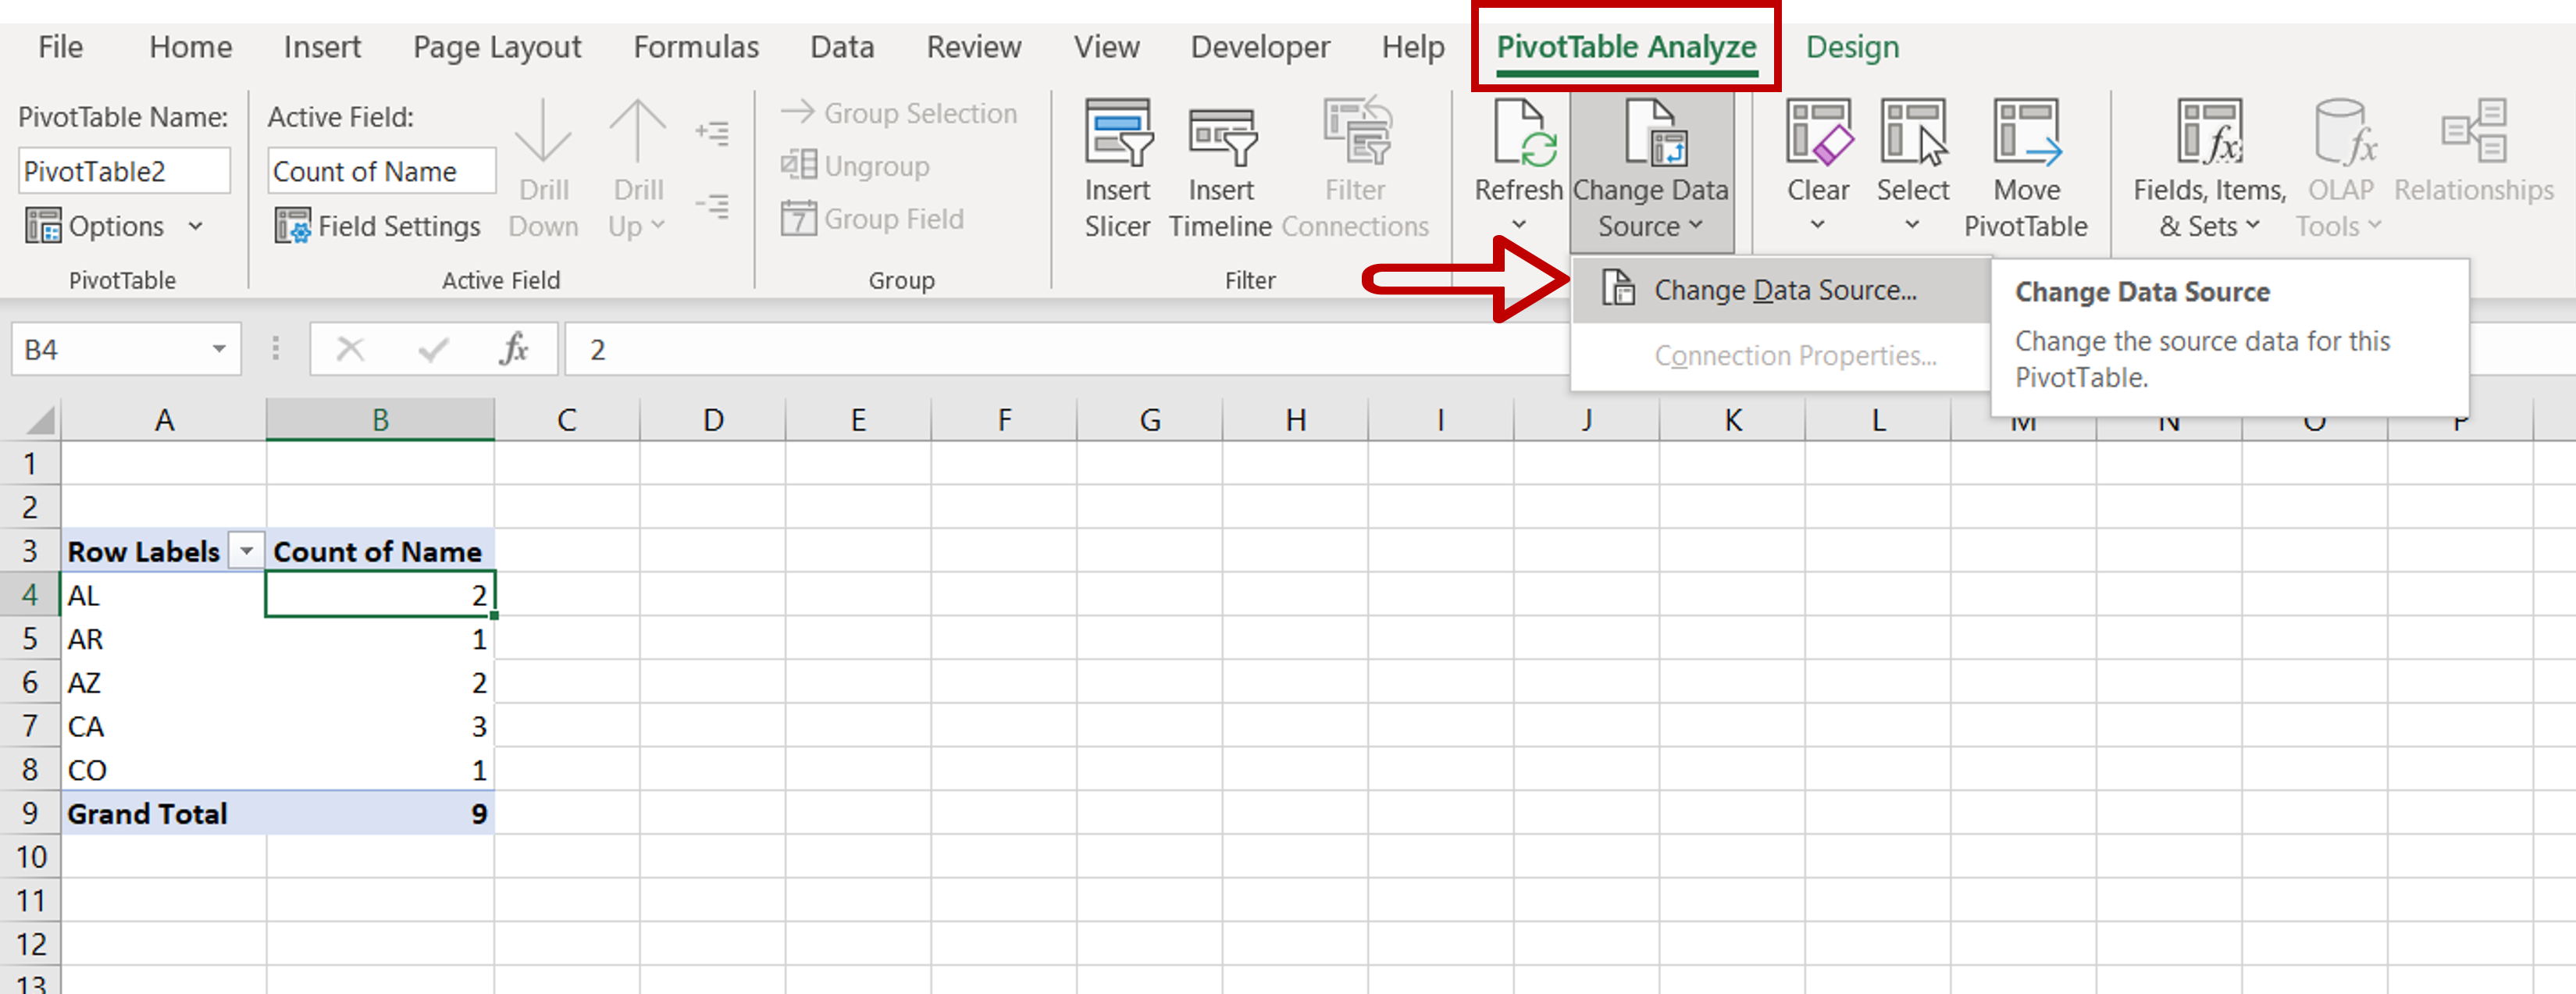
– Click anywhere in the pivot table
– Go to PivotTable Analyze > Data
– Click on the Change Data Source button
Step 2 – Change the range
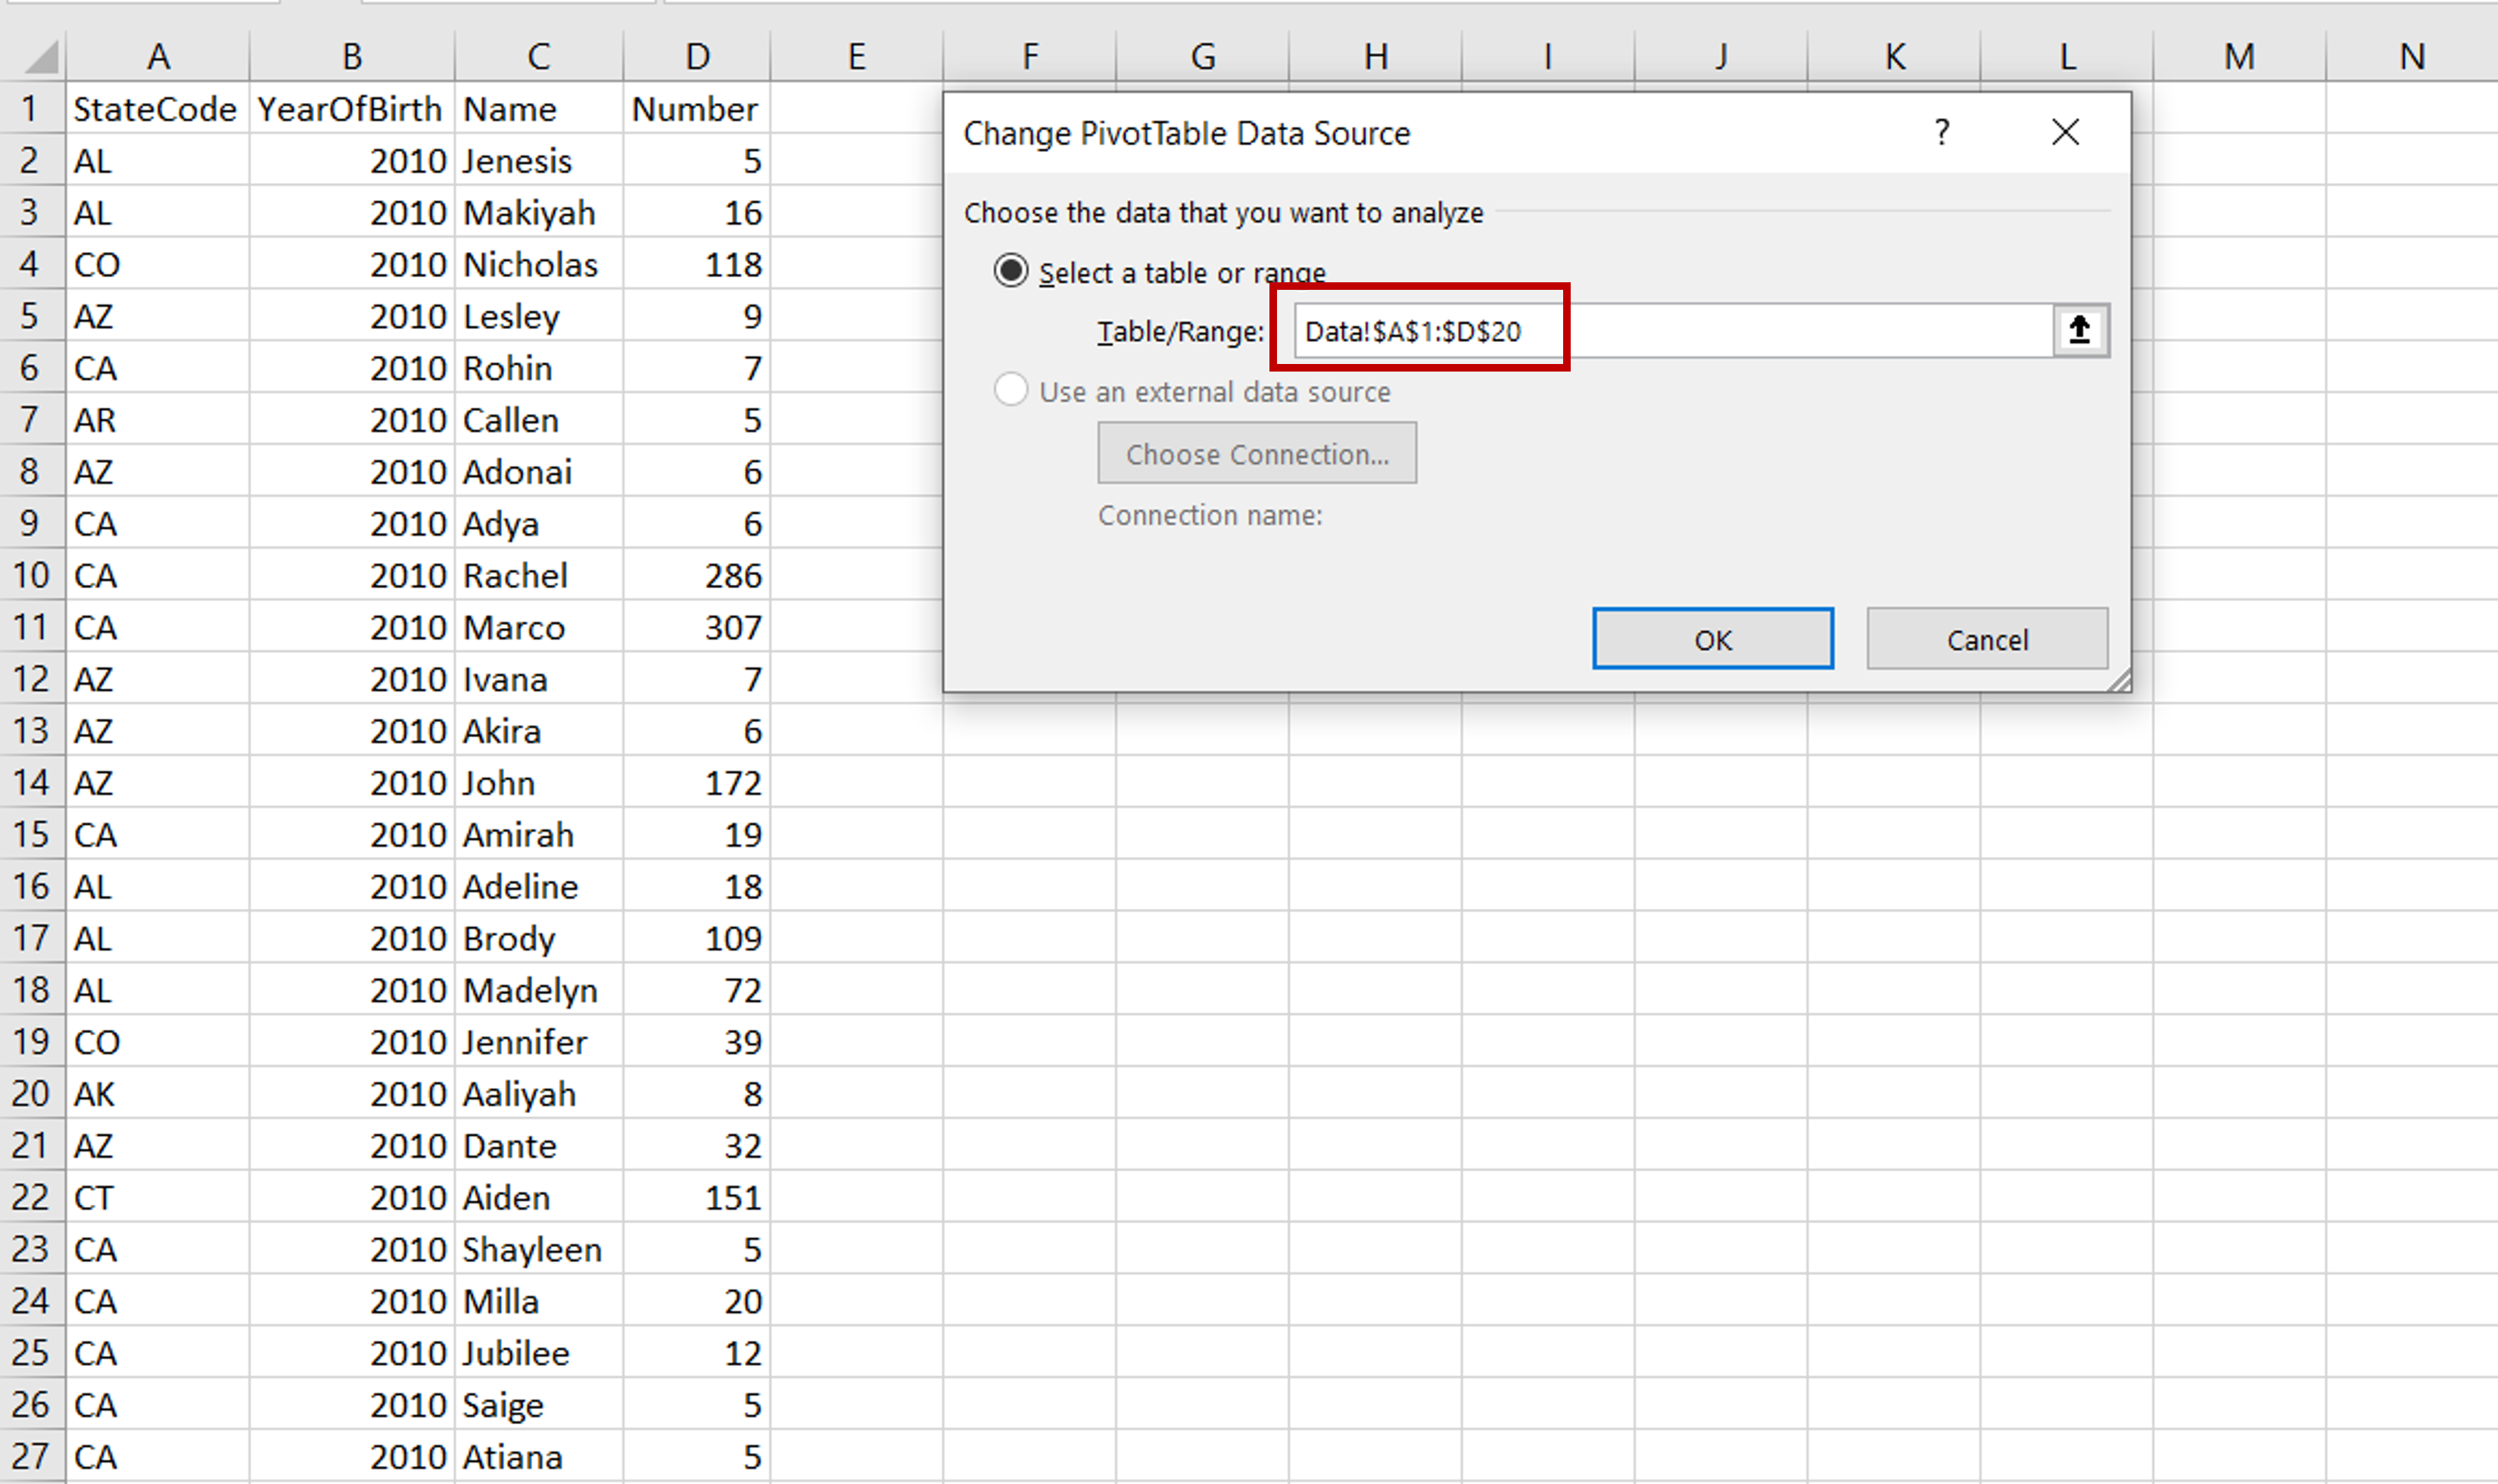
– In the window, change the range of the source data
– Click OK
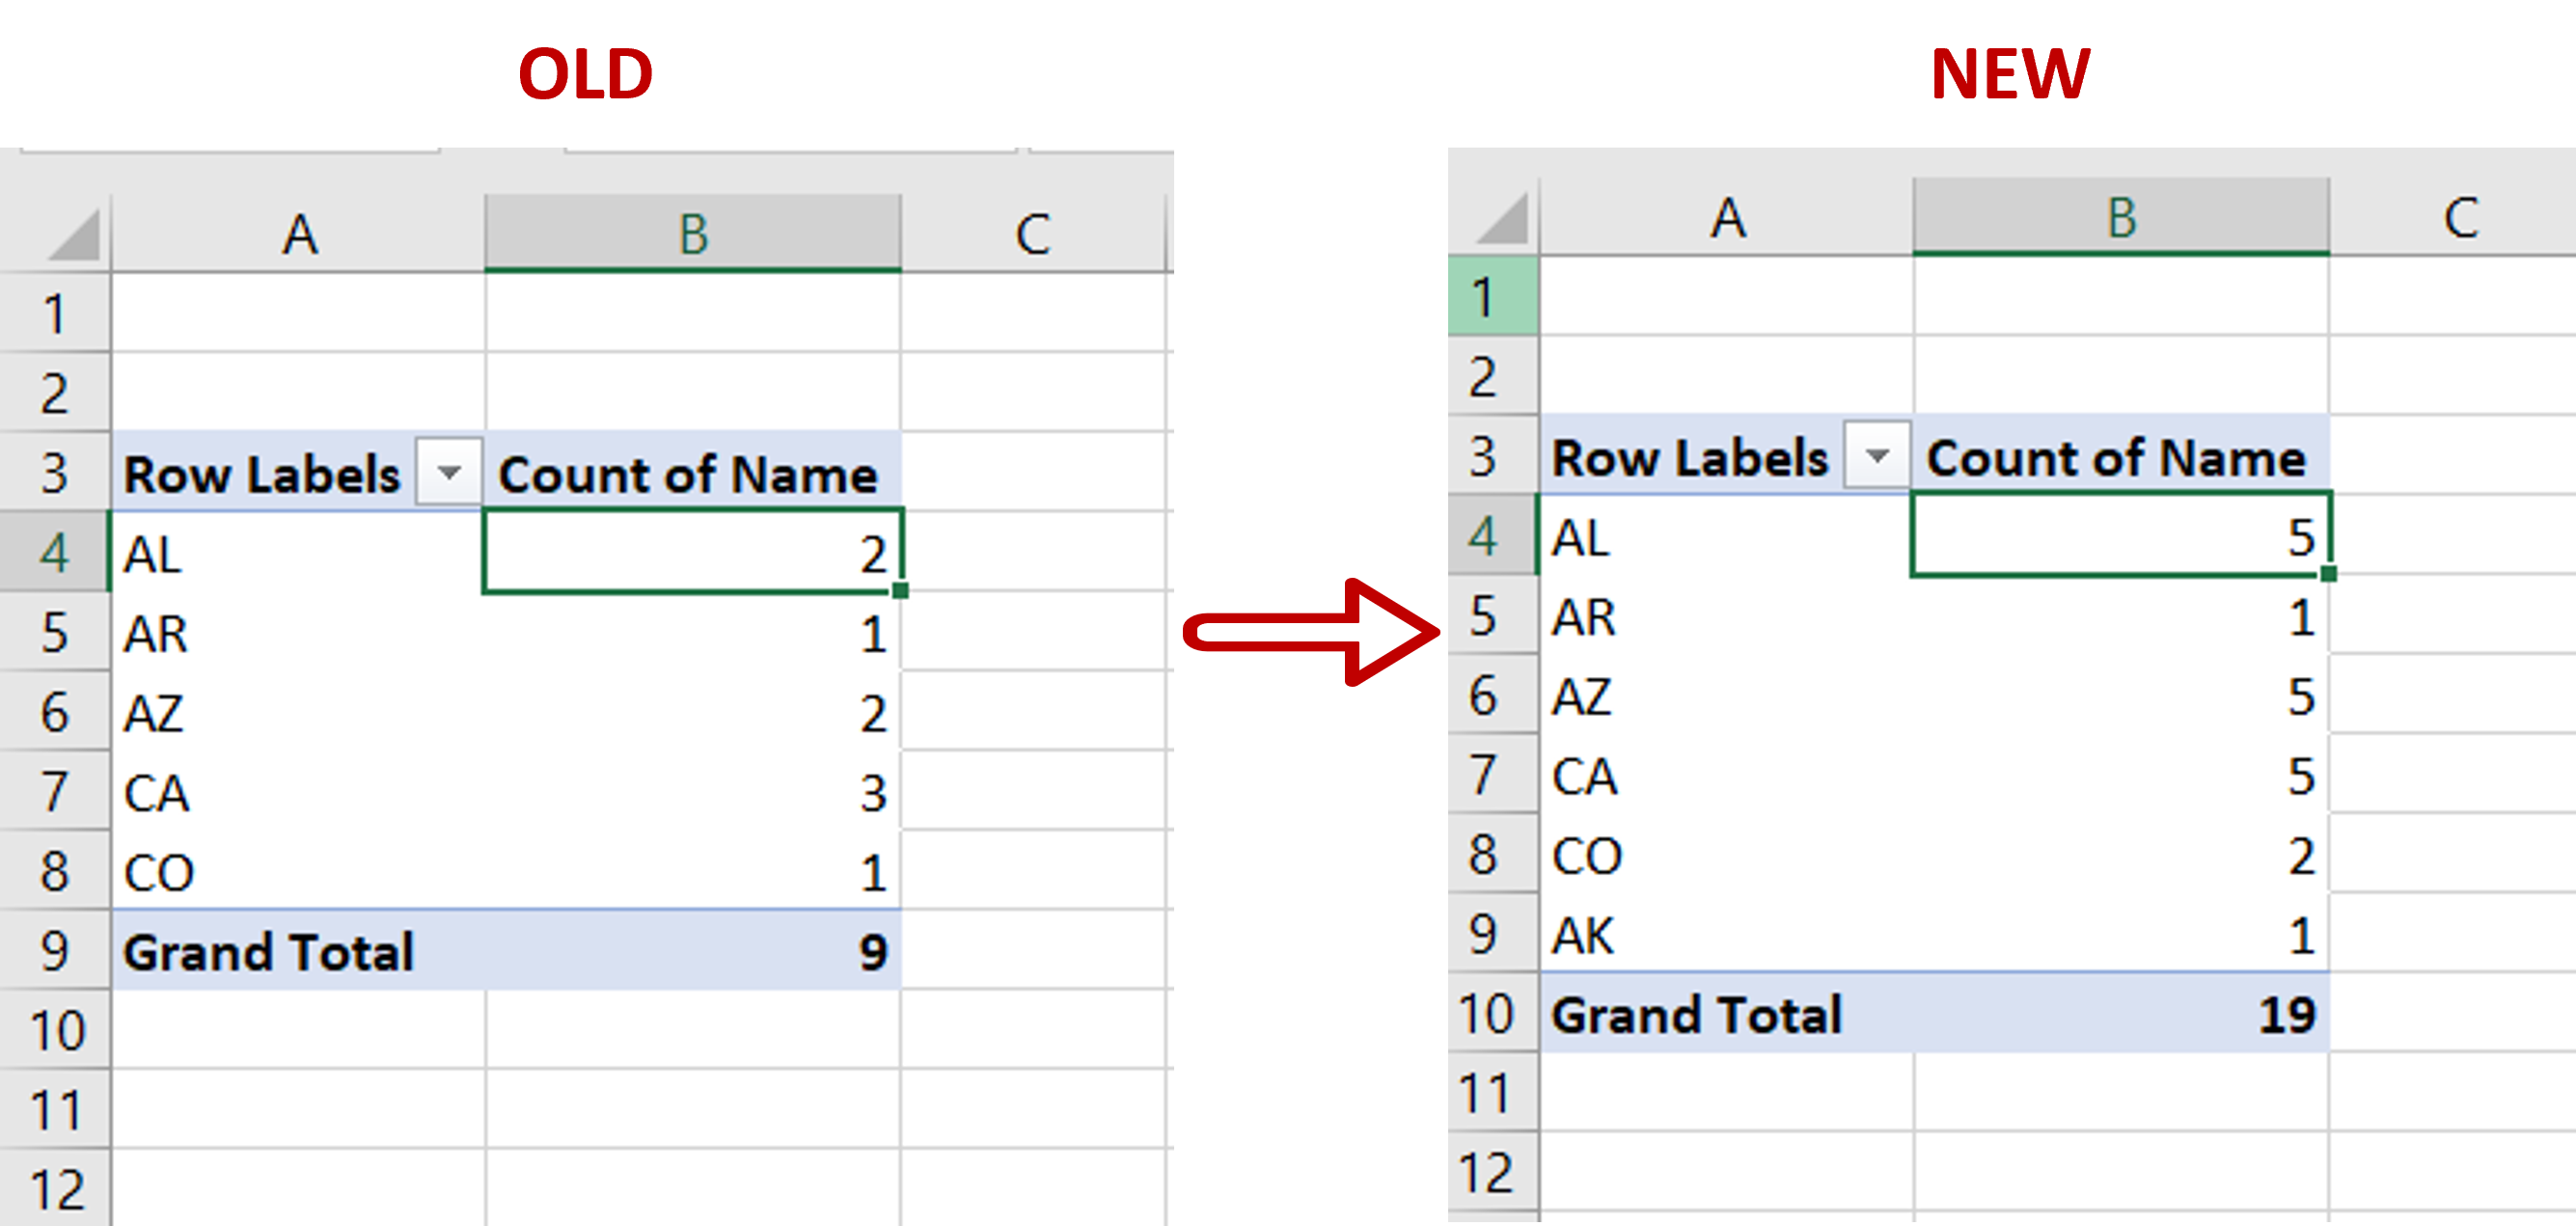
Step 3 – Check the result

– Check that the pivot table numbers have changed


