
How to change the number of bins in an Excel histogram
 By
SpreadCheaters
By
SpreadCheaters
Page last updated:
05/01/2023 |
Next review date:
05/01/2025
You can watch a video tutorial here.
Histograms are used to organize data in a way that is easy to understand. A histogram is built from a frequency table that tells you the frequency or how often an event occurs. The frequency values are organized as bins or ranges of values. When you create a histogram in Excel, it automatically creates bins based on the data. You may want to change the number of bins to make the chart easier to understand.
Step 1 – Open the Format Axis box
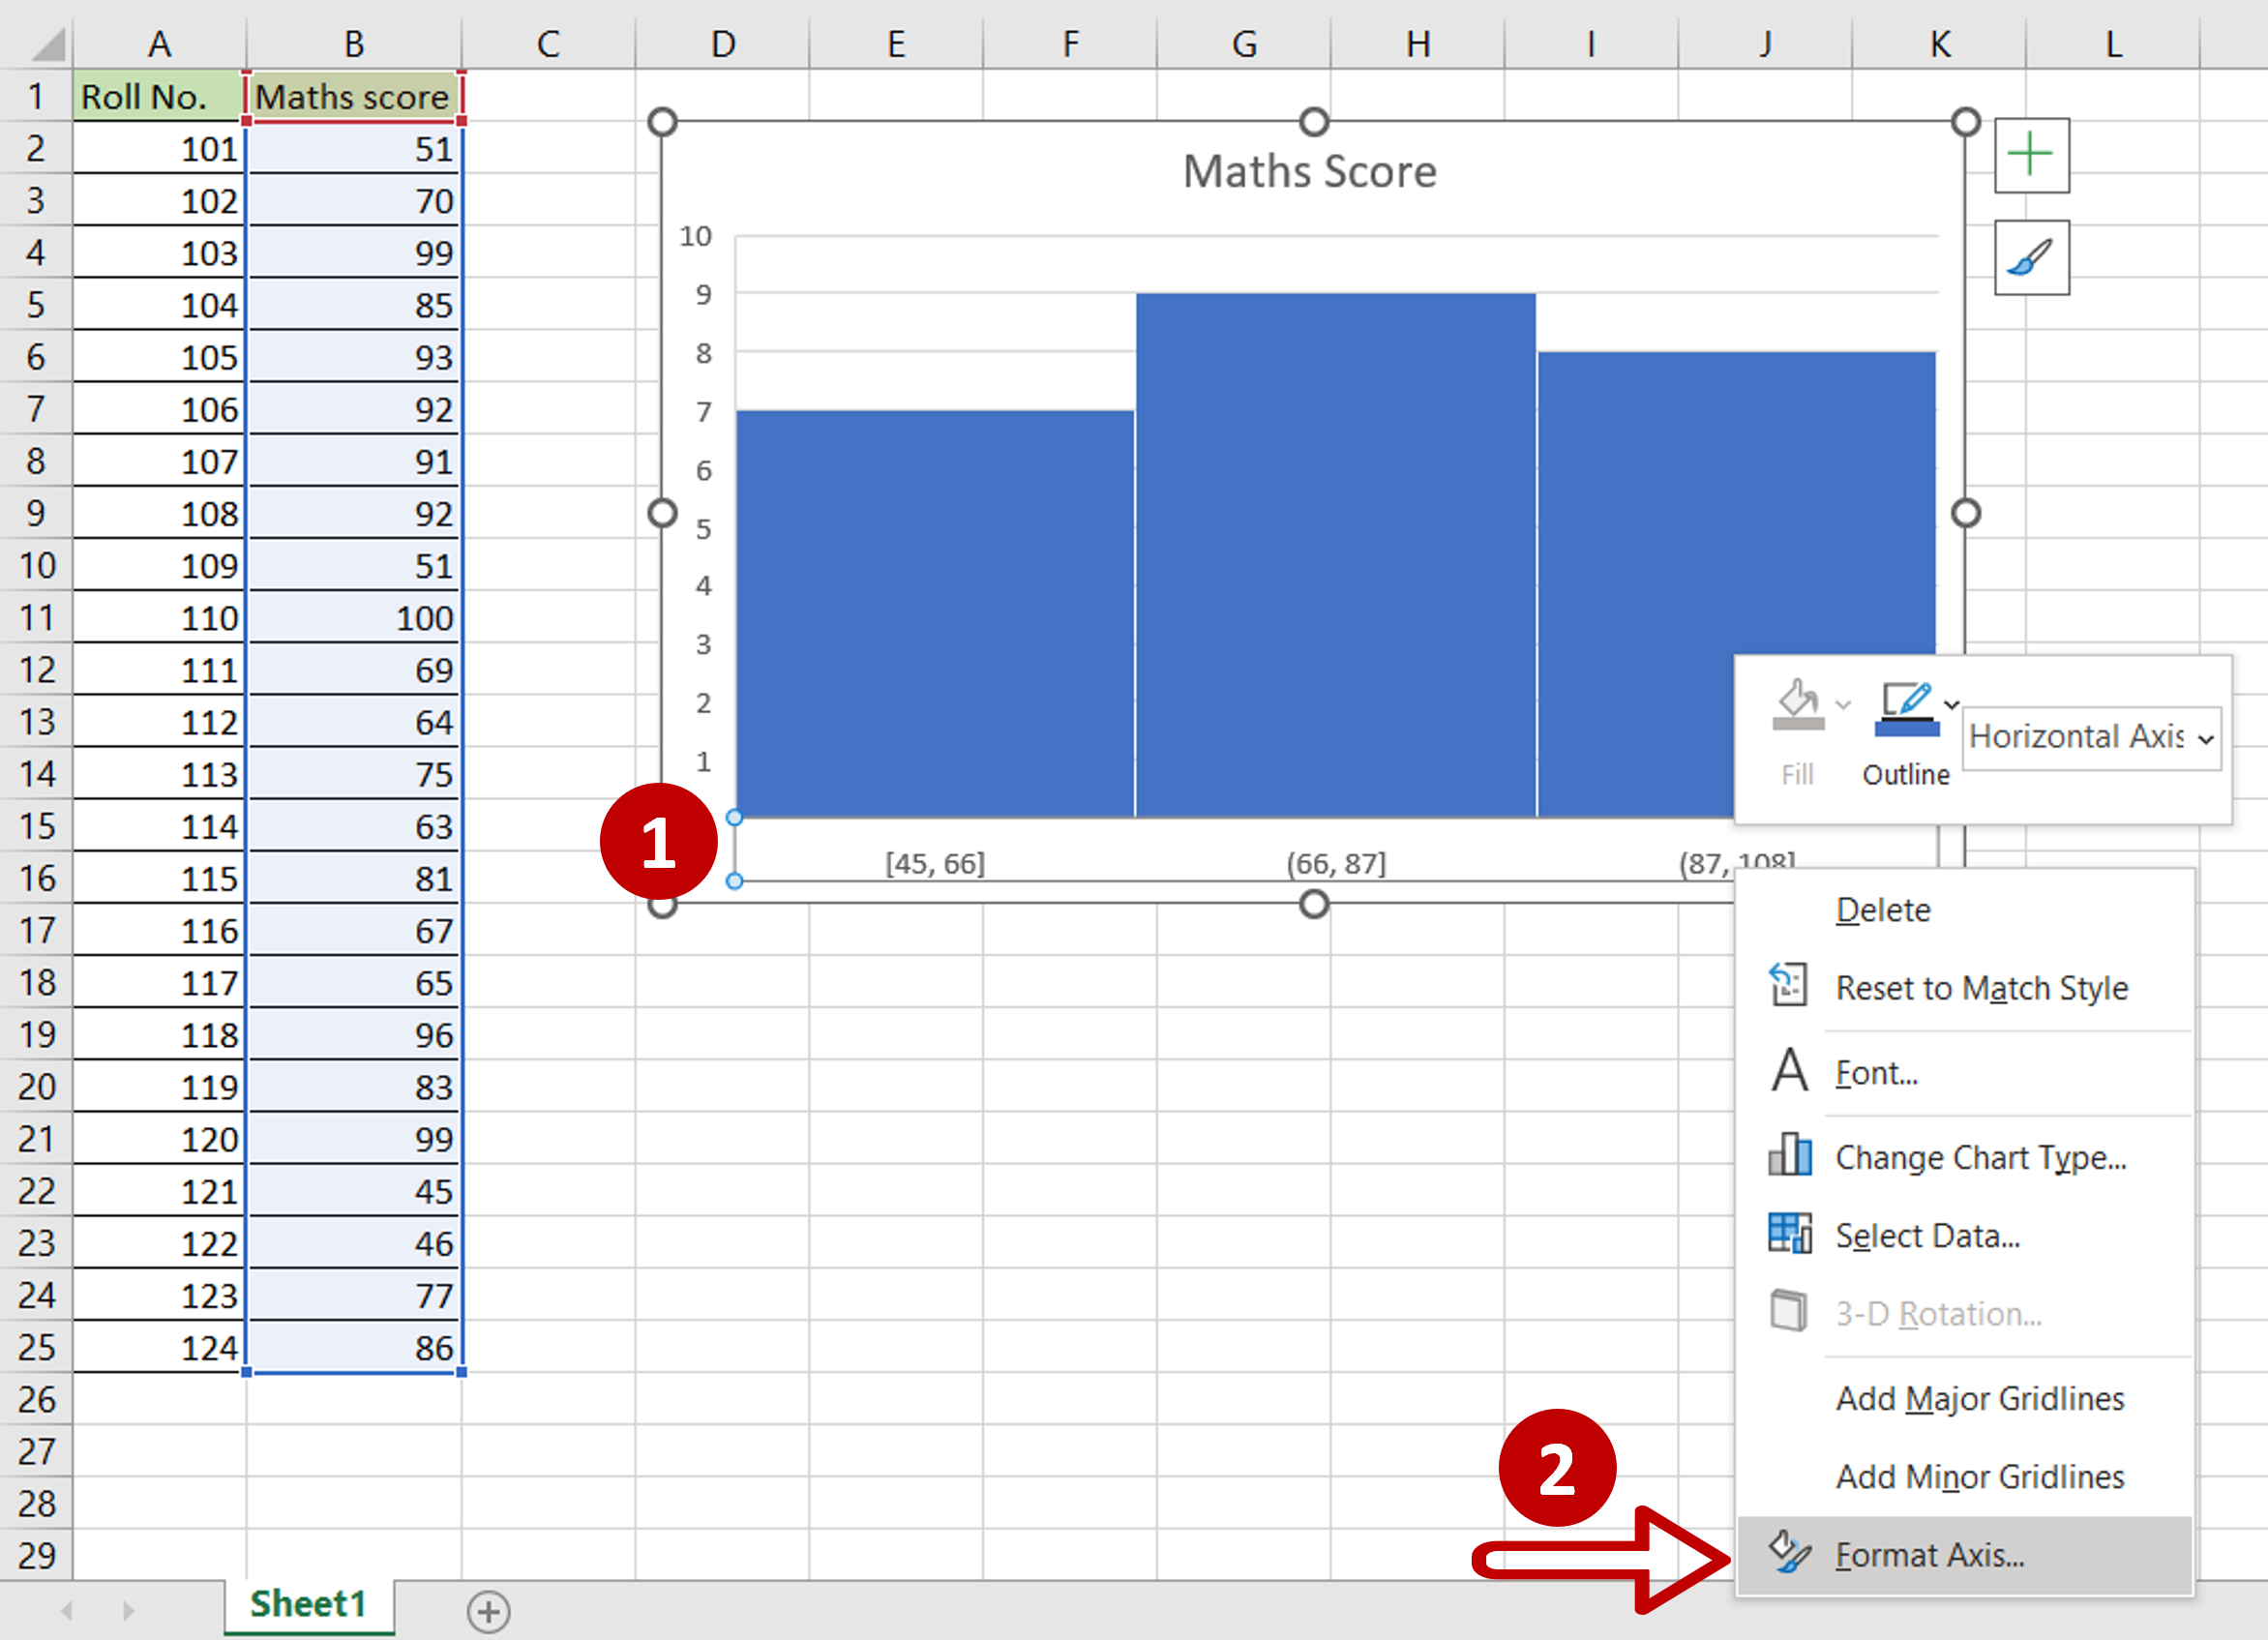
– On the chart, click on the axis
– Right-click and select Format Axis from the context menu
Step 2 – Change the number of bins
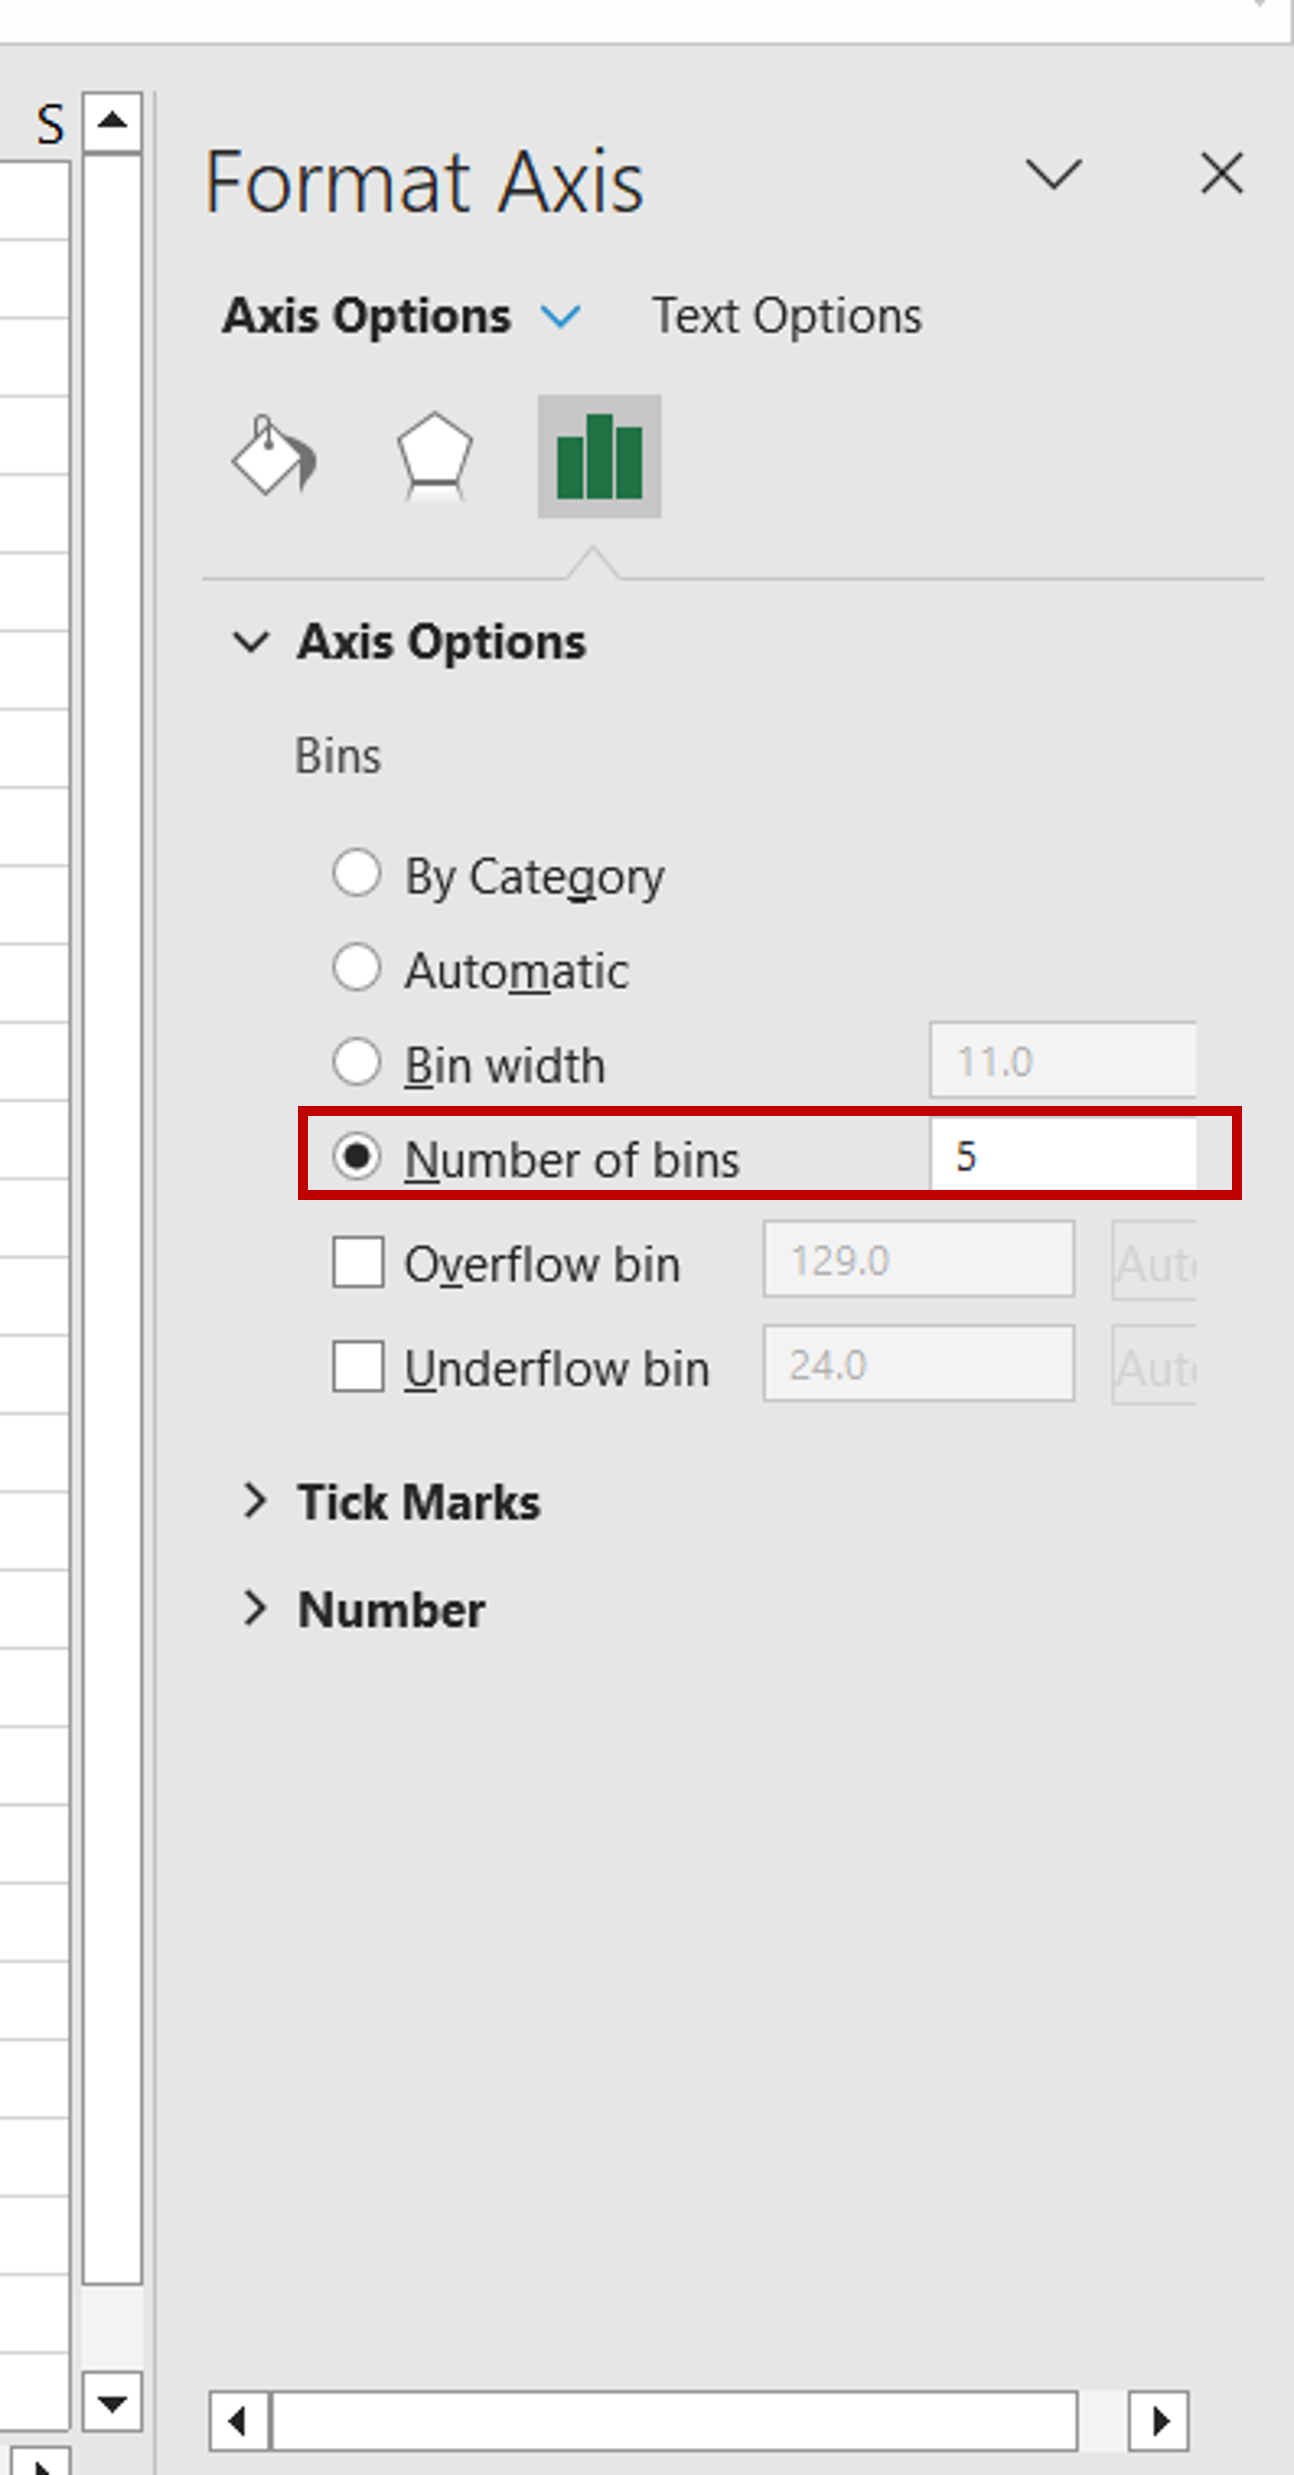
– Change the number of bins to 5
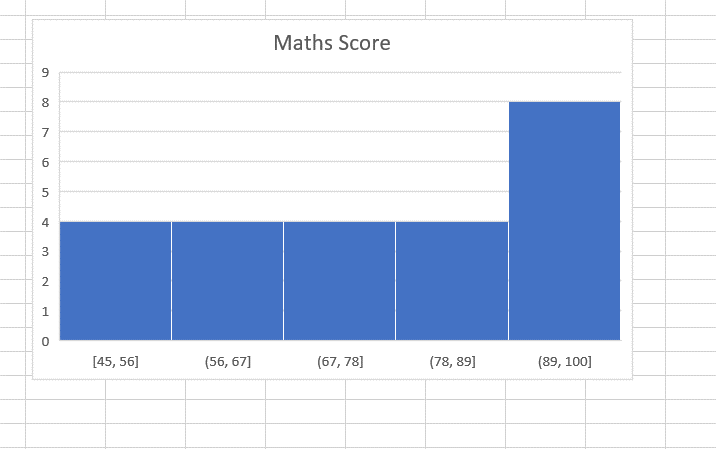
Step 3 – Check the result
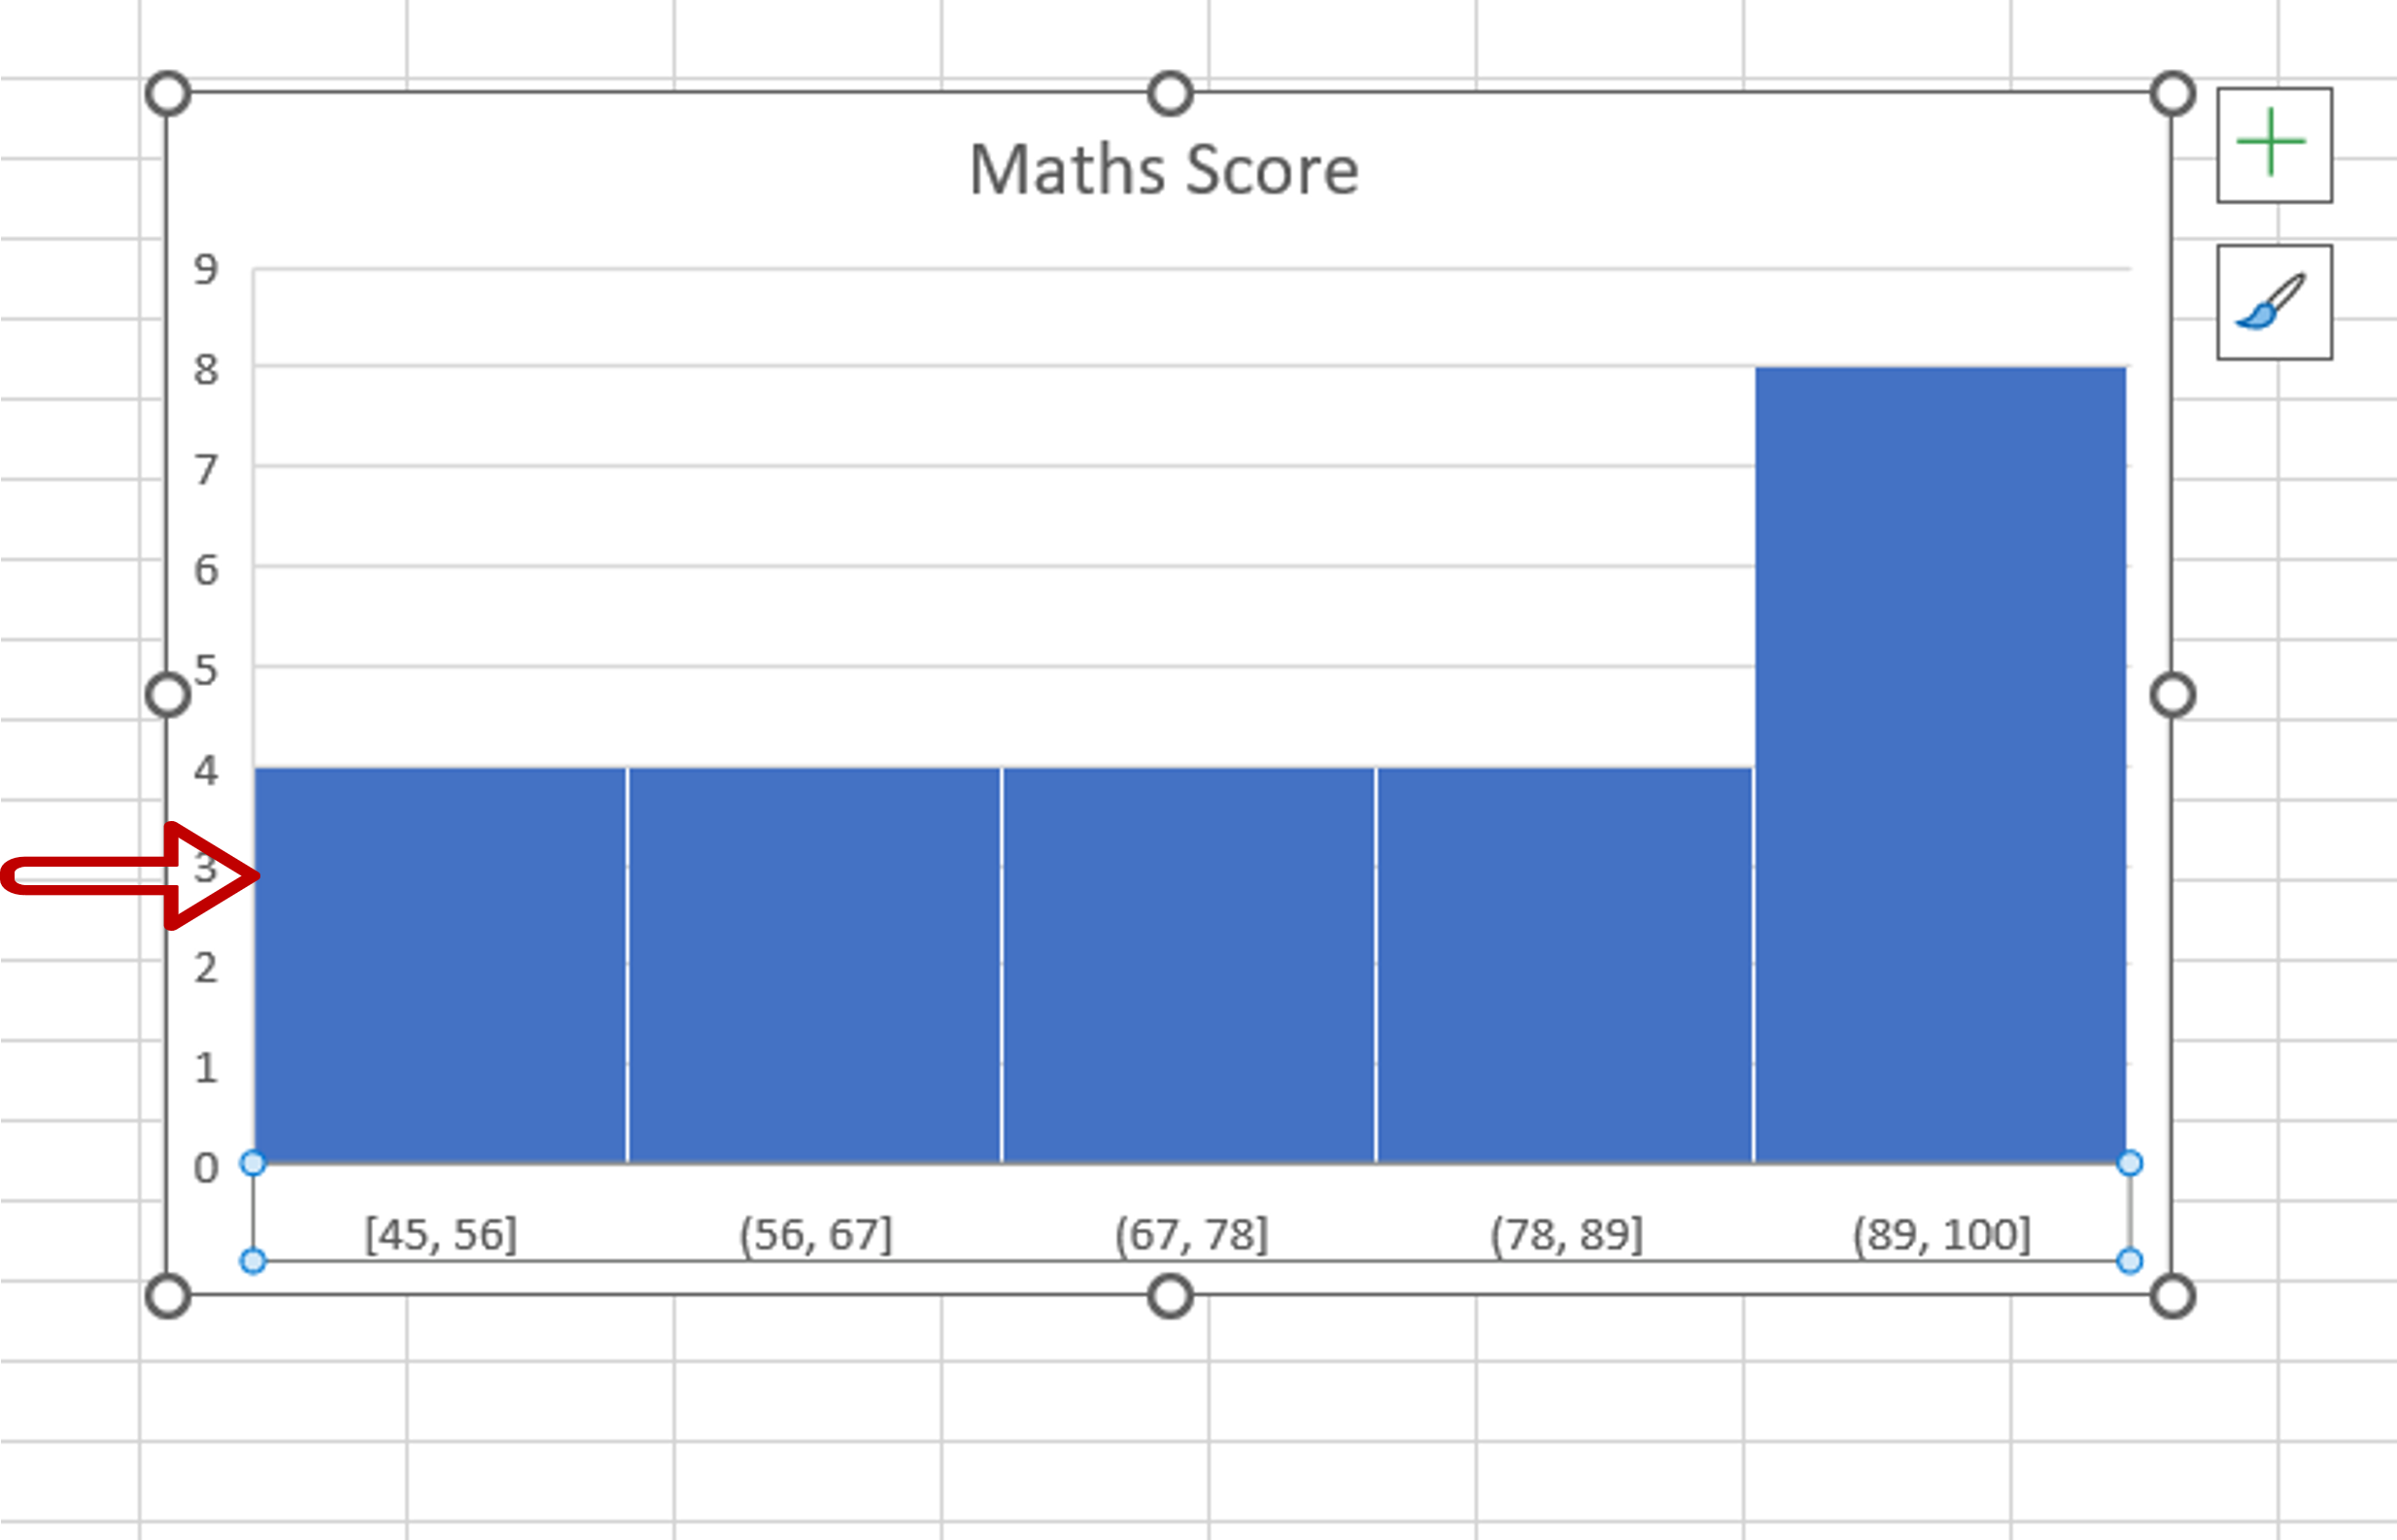
– The number of bins changes to 5
– The size or width of each bin changes accordingly


