
How to change axis range in Excel
 By
SpreadCheaters
By
SpreadCheaters
Page last updated:
16/11/2022 |
Next review date:
16/11/2024
You can watch a video tutorial here.
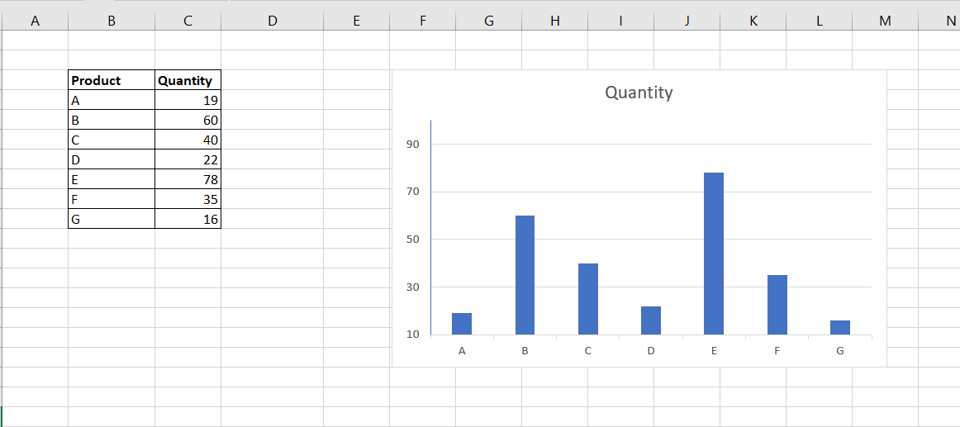
When you create a chart in Excel, the default settings are applied for the axes, based on the values of the data. You may need to customize the chart by changing the values of the axes.
Step 1 – Open the Format Axis menu

– Select the axis that is to be changed
– Right-click and select Format Axis from the context menu
Step 2 – Change the range

– Change the Minimum and/or Maximum bounds to change the range of the axis
Note: Click Reset to change the values back to the default
Alternate access to the Format Axis menu
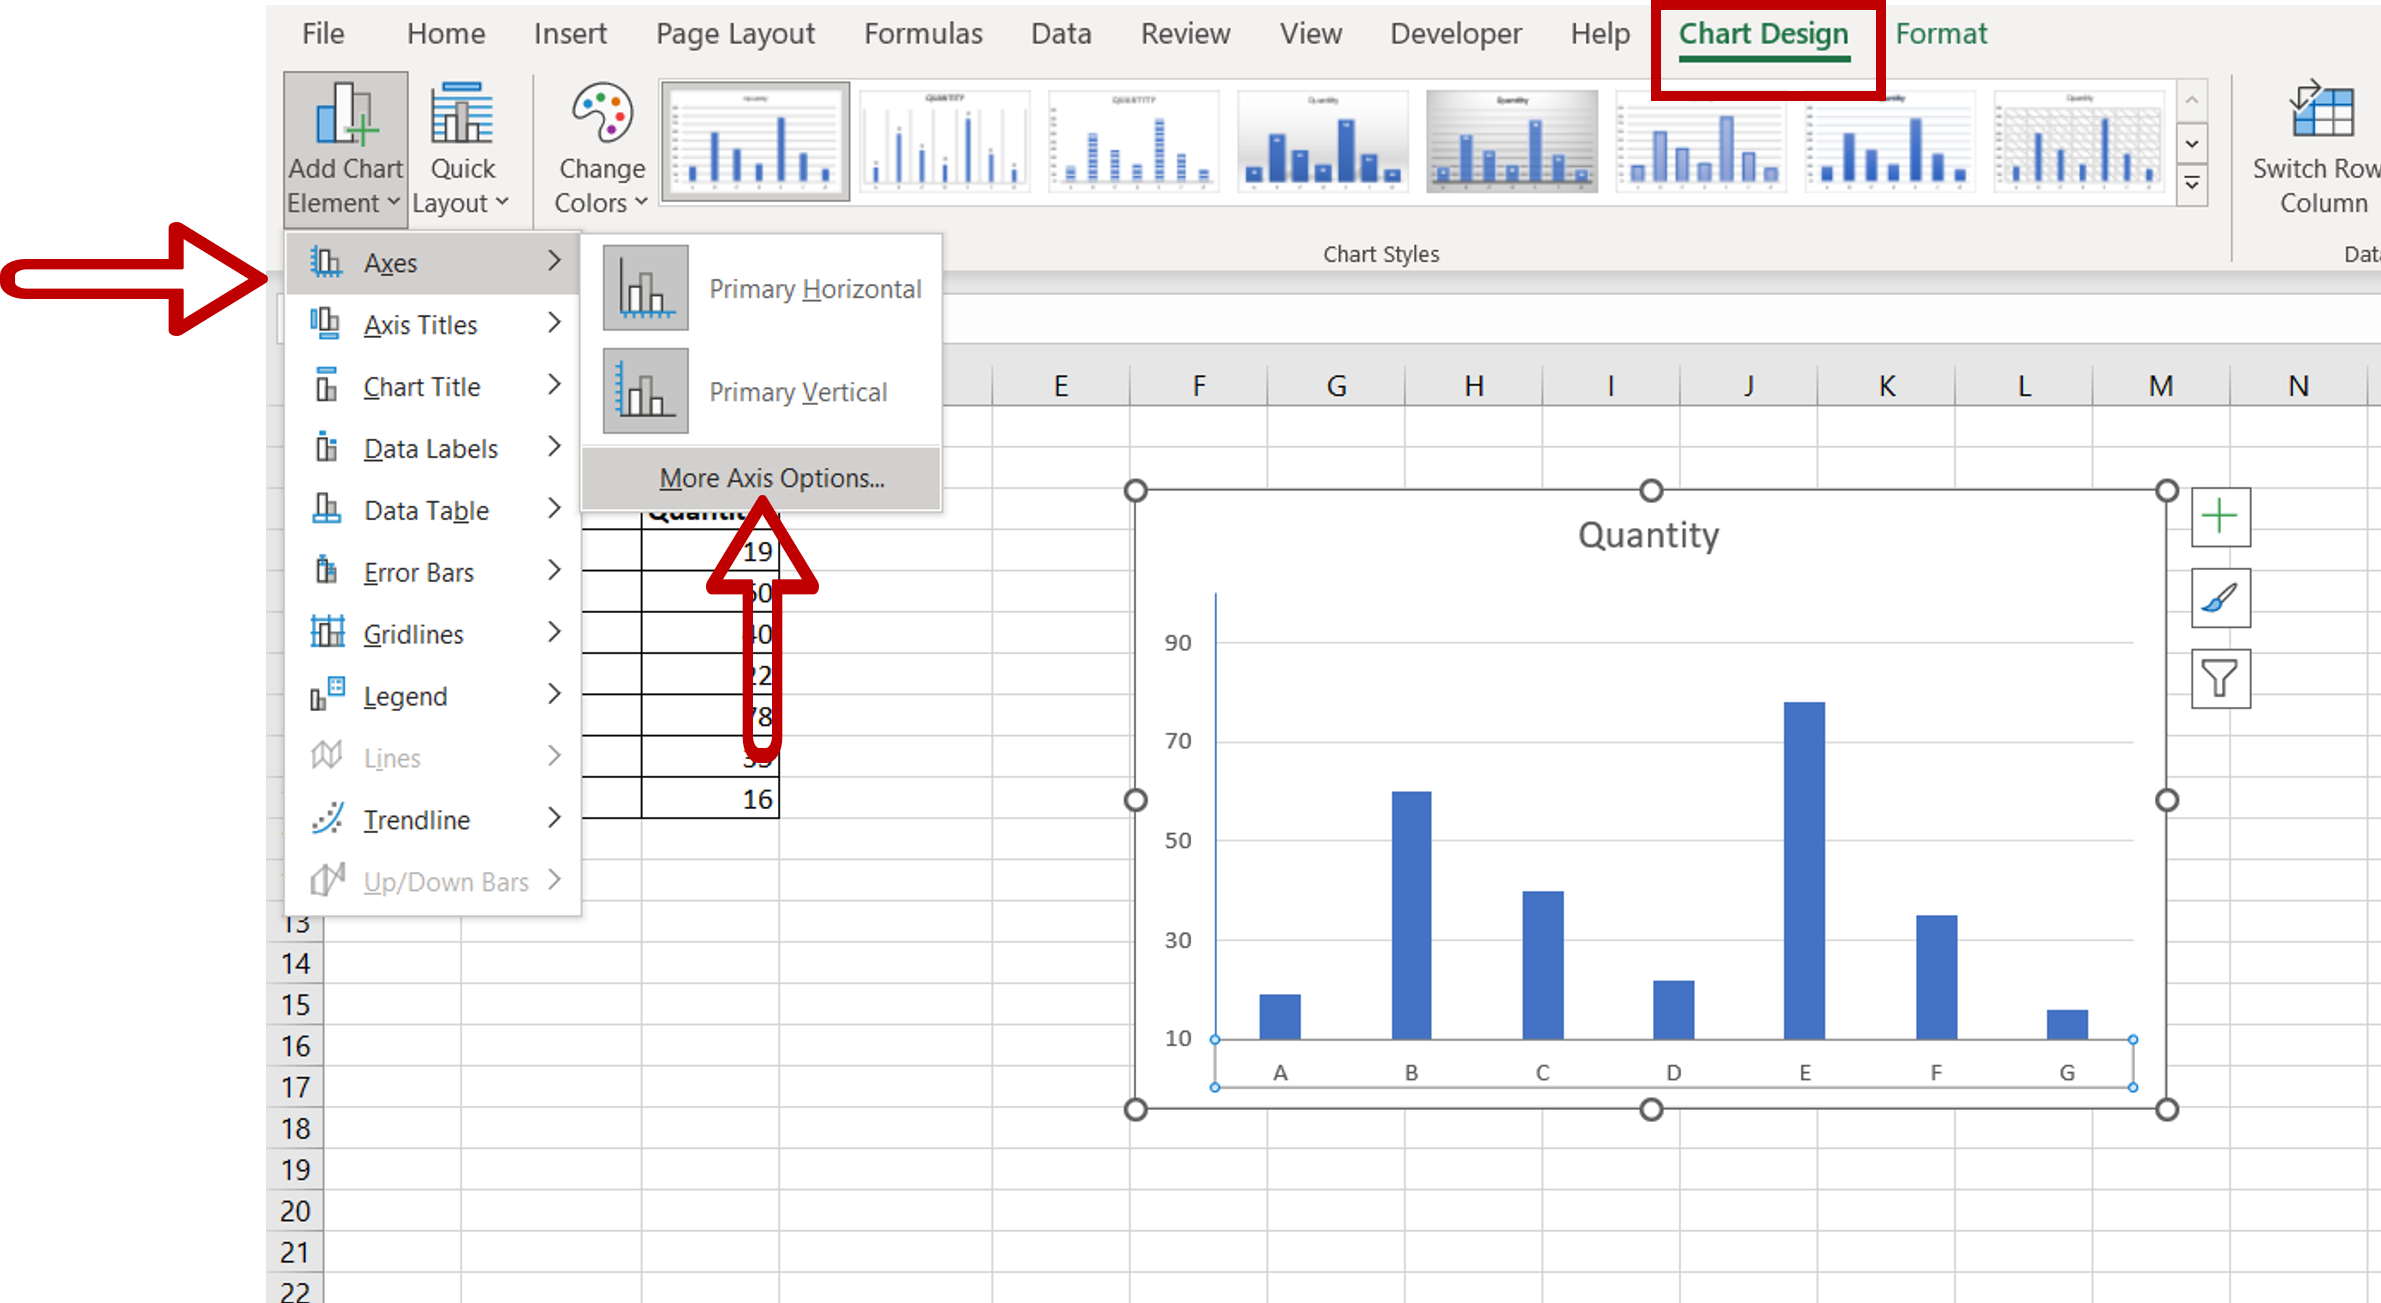
– Select the chart
– On the Chart Design menu, go to Add Chart Element > Axes > More Axis Options


