
How to calculate z-values in Microsoft Excel
 By
SpreadCheaters
By
SpreadCheaters
In this tutorial, we will learn how to calculate z-values in Microsoft Excel. Performing statistical analysis using Excel is a common practice, and calculating z-values is a task that can also be accomplished using this tool. The generic formula to calculate z-values is:
(value – mean)/(standard deviation). Symoblically it can be written as; z = (X – μ) / σ
In this article, we will delve into the process of calculating z-values in Excel.
Let’s say you are a teacher, and you want to compare the performance of the students to the national average on a test. You have the scores of all your students.
Z-values, also referred to as z-scores, are a statistical metric that enables us to determine the number of standard deviations by which a data point deviates from the mean of a dataset. This metric is valuable in statistical analysis as it offers insights into the distribution of data.
Step 1 – Choose an Empty Cell
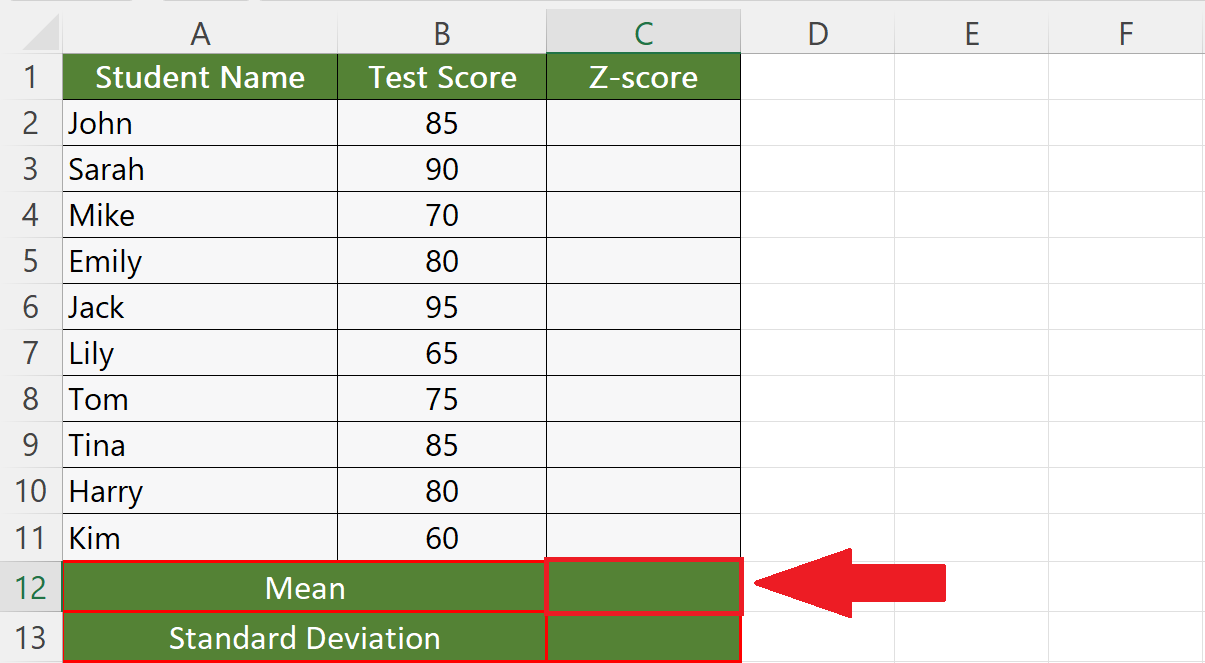
– Choose an empty cell to calculate the mean of the data.
Step 2 – Calculate the Mean of the Data
– Calculate the mean of the data.
– For this, utilize the AVERAGE function:
AVERAGE(B2:B11)
– Where B2:B11 is the range of cells that holds the score of all the students.
– Hit the Enter key.
Step 3 – Calculate the Standard Deviation
– Choose an empty cell.
– Enter the STDEV.P function:
STDEV.P(B2:B11)
– Where B2:B11 is the range of cells that holds the score of all the students.
– Hit the Enter key.
Step 4 – Choose an Empty Cell in the Z-Value Column
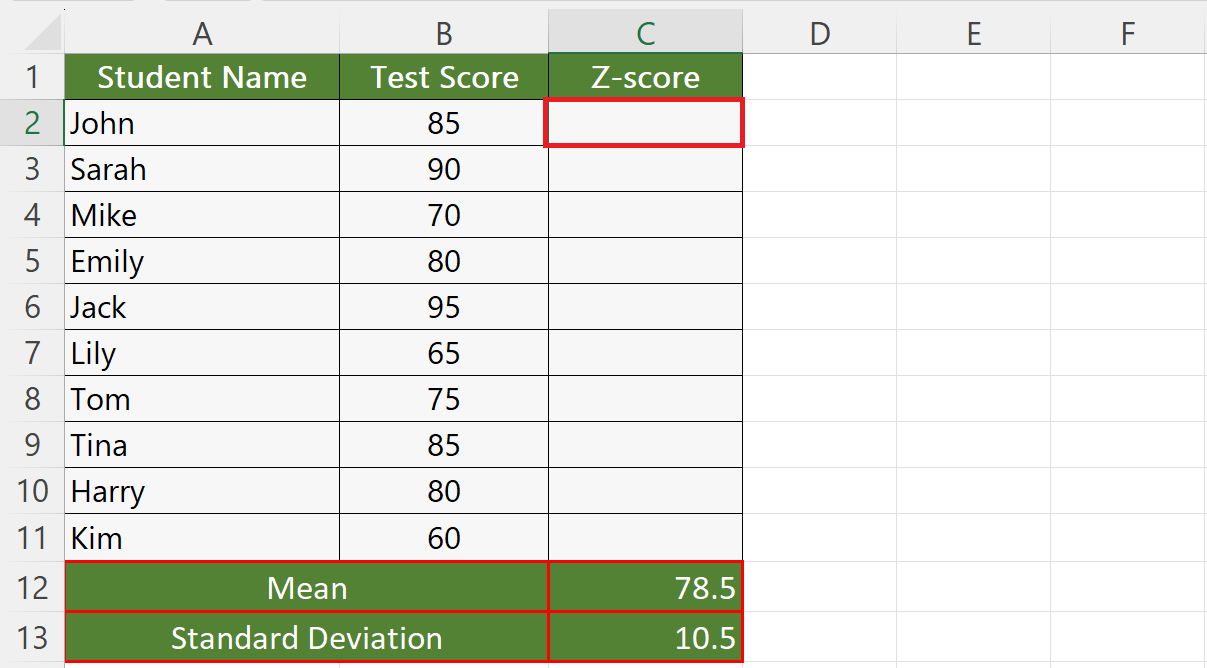
– Choose an empty cell in the Z-Value column to calculate the Z-score.
Step 5 – Calculate the Z-Value
– To calculate the z-values, use the generic formula:
(B2-C12)/(C13)
– Where the cells B2, C12, and C13 contain the student’s score, mean, and standard deviation, respectively.
– Hit the enter key.
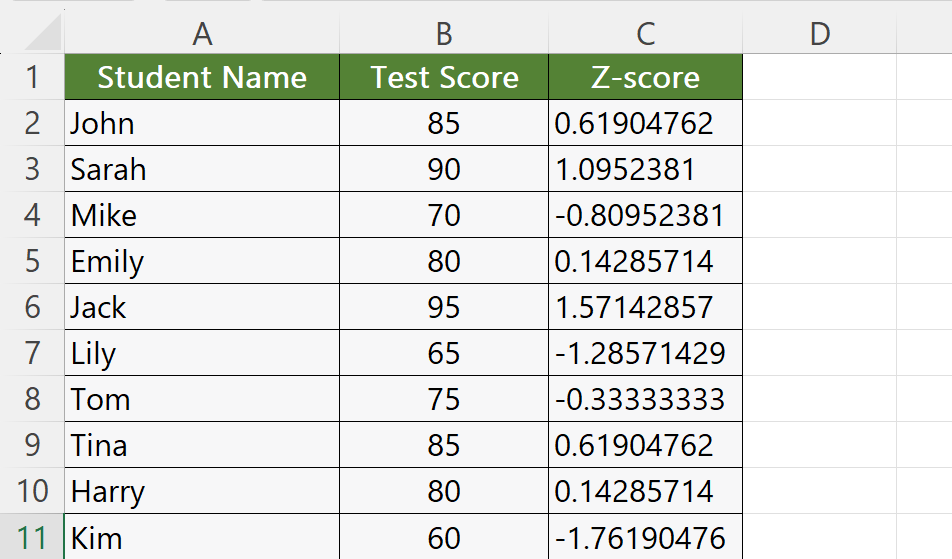
– The z-value will be returned.
Step 6 – Utilize Autofill to Calculate Z-Value for Each Student
– Utilize Autofill to calculate z-value for each student.
Step 7 – Understanding the Meaning of Z-values

– Z-values represent the distance of a data point from the mean of a distribution in terms of standard deviations.
– A value of 0 indicates the data point is at the mean.
– A positive z-value means the data point is above the mean.
– While a negative z-value means the data point is below the mean. The further the z-value is from 0, the further away the data point is from the mean.


