
How to calculate the Z score to percentile in Excel
 By
SpreadCheaters
By
SpreadCheaters
Z-score is the numerical representation of the relationship of a value with the mean of a group of values. Z-score is measured with reference to standard deviations from the mean. A Z-score of 0 means that the data point is identical to the mean. A negative score means that the data point is below the mean and similarly a positive value means that data point is above the mean. Excel provides us with a built-in function. Before starting we would learn the syntax of formula.
=NORM.S.DIST(z,cumulative)
Z = z-score.
Cumulative = True returns the communicative distribution function, false returns the probability distribution function.
Below are the steps to follow;
Excel is a data oriented software produced by Microsoft. It is a data modeling application. Excel enables users to organize and manage data models of statistics in spreadsheets. In this tutorial, we will learn how to convert Z-score to percentile.
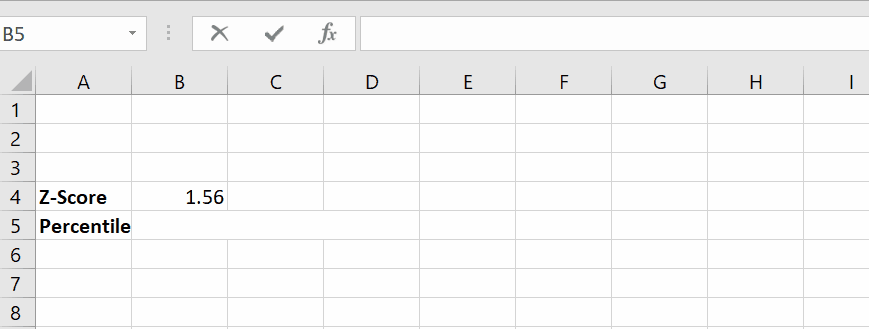
Step 1 – Select a cell and apply formula

– Select a cell, where you wish to calculate the percentile.
– Apply the formula, =NORM.S.DIST(z,cumulative)
– In this case the value for z is 1.56 in B4 cell.
– As soon as you press the enter key the percentile will be calculated. Below is the animation as an example to calculate Z score to percentile;
Resultantly, the value of percentile is 0.940. It turns out that z score of 1.56 corresponds to a percentile of 94.0 approximately.


