
How to calculate standard error in excel
 By
SpreadCheaters
By
SpreadCheaters
Page last updated:
17/11/2022 |
Next review date:
17/11/2024
You can watch a video tutorial here.
In statistical analysis, it is not possible to collect data from the entire population that you are studying. Most often, analysis is done on samples to understand the population. The standard error is a metric that indicates how accurate the mean of the sample is in relation to the mean of the population. Excel does not have a function to compute the standard error, but you can calculate it using the mathematical formula or the Data Analysis tool.
- The mathematical formula for Standard error is:
- Standard error = Standard deviation of the sample/Square root of the number of samples
- Standard deviation is calculated using the STDEV.S() function
- The square root is calculated using the SQRT() function
- Standard error = Standard deviation of the sample/Square root of the number of samples
- STDEV.S() function: returns the standard deviation of the sample
- Syntax: STDEV.S(range of numbers)
- SQRT() function: this returns the square root of a number
- Syntax: SQRT(number)
Option 1 – Use the formula
Step 1 – Calculate the standard deviation
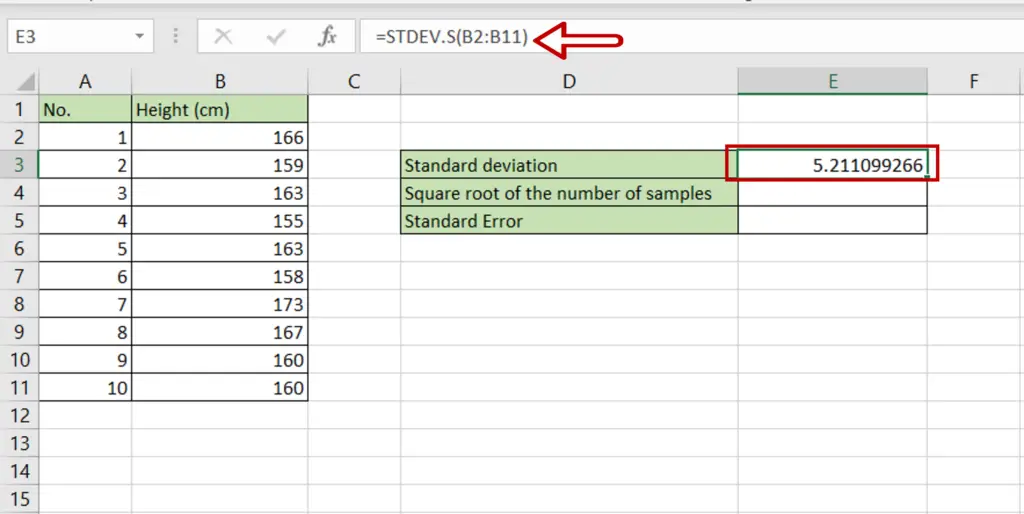
- Select the cell where the result is to be displayed
- Type the formula using cell references:
=STDEV.S(range of Height (cm))
- Press Enter
Step 2 – Calculate the square root of the number of samples
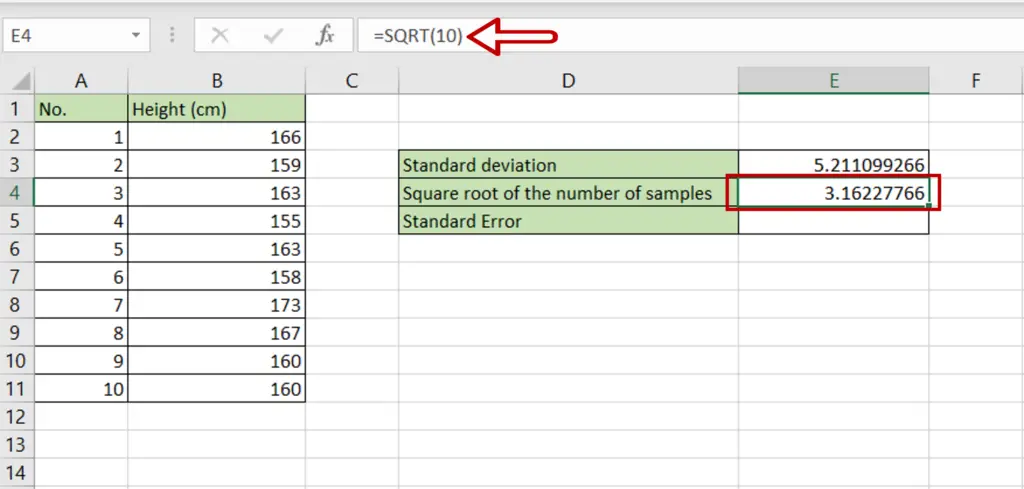
- Select the cell where the result is to be displayed
- Type the formula using cell references:
=SQRT(10)
- Press Enter
Step 3 – Calculate the Standard error
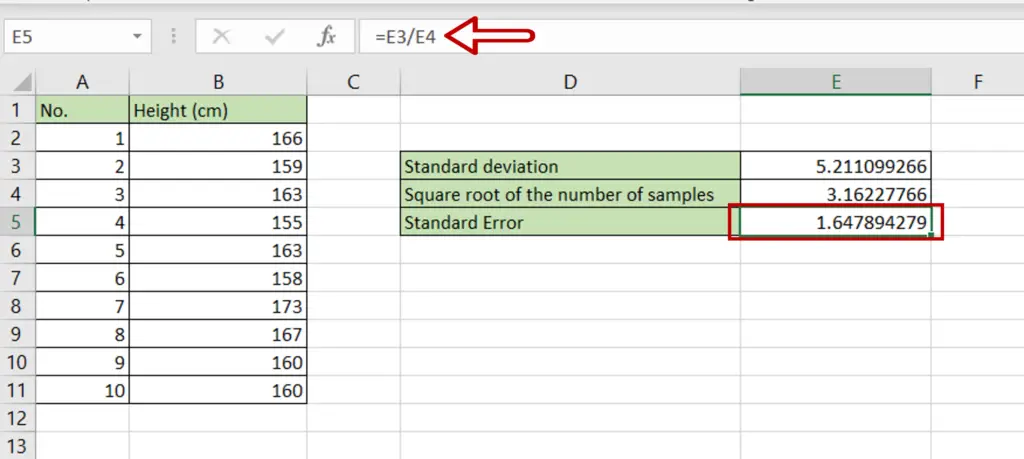
- Select the cell where the result is to be displayed
- Type the formula using cell references:
= Standard deviation/ Square root of the number of samples
- Press Enter
Option 2 – Use the Data Analysis tool
If the Data Analysis button is on the Data > Analyze ribbon, then skip Steps 1 to 3 below.
Step 1 – Open the Excel Options window

- Go to File > Options
Step 2 – Manage the Add-ins
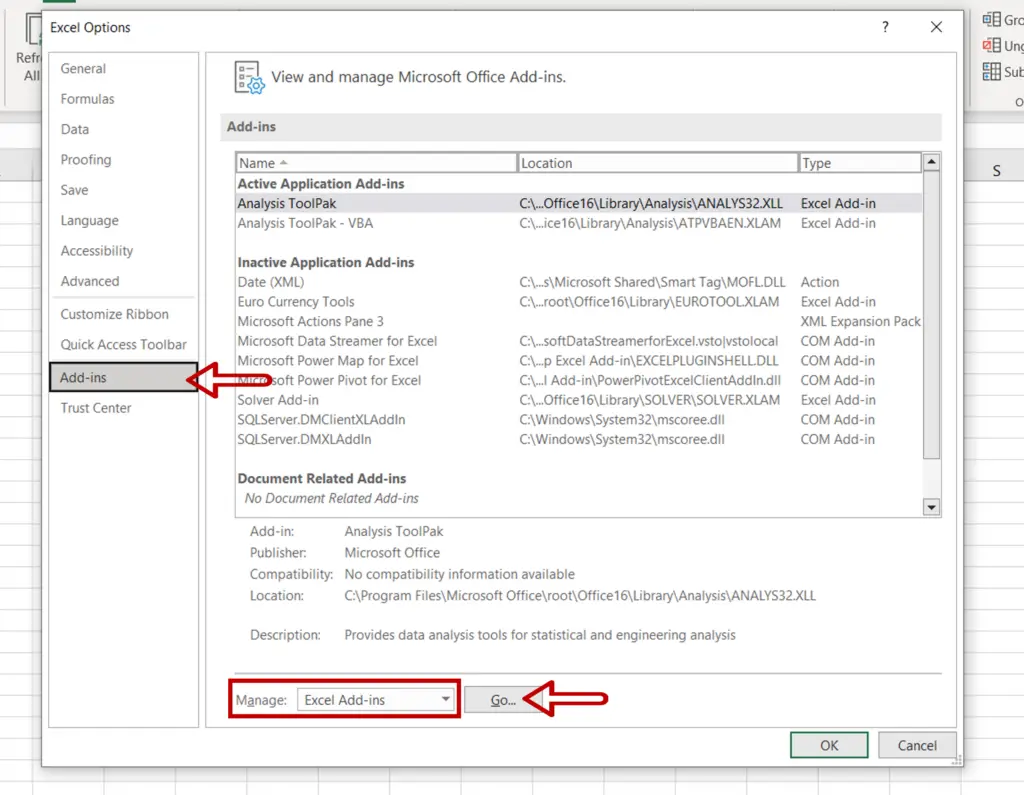
- Go to Add-ins
- Select Excel Add-ins from the Manage drop-down
- Click Go
Step 3 – Load the Analysis ToolPak add-in
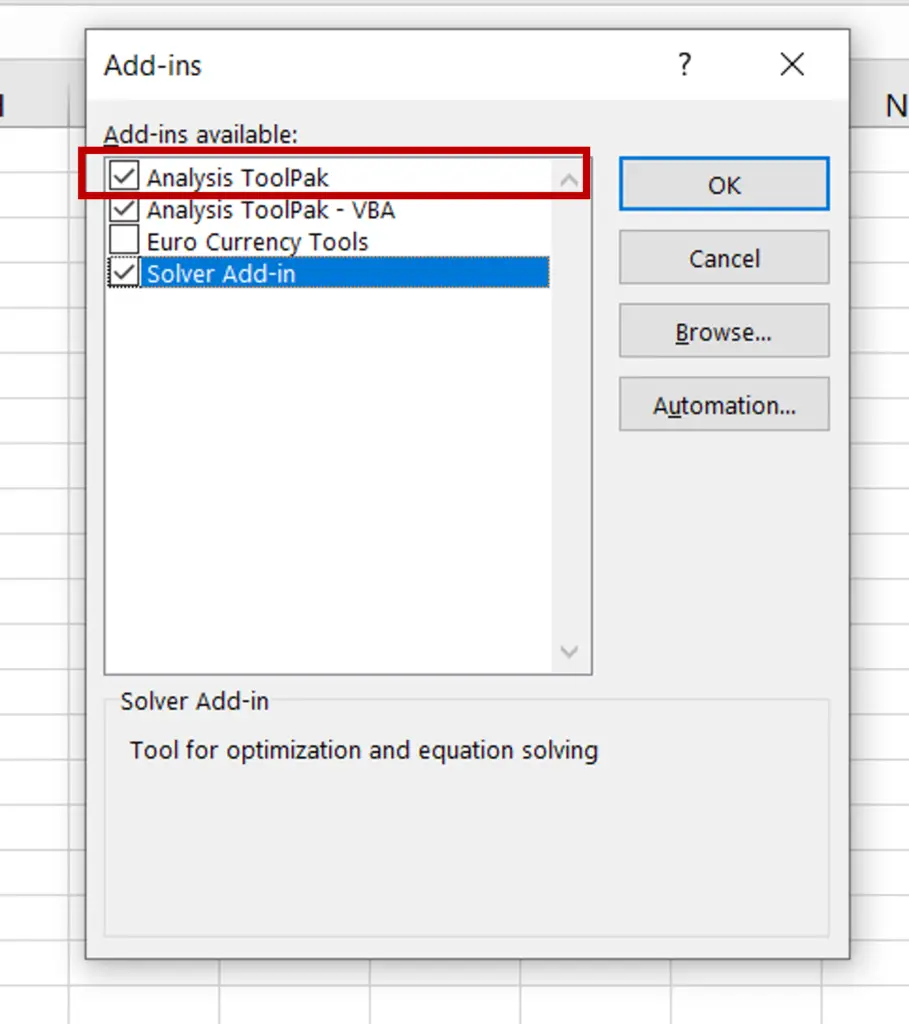
- Select Analysis ToolPak
- Click OK
Step 4 – Open the Descriptive Statistics window
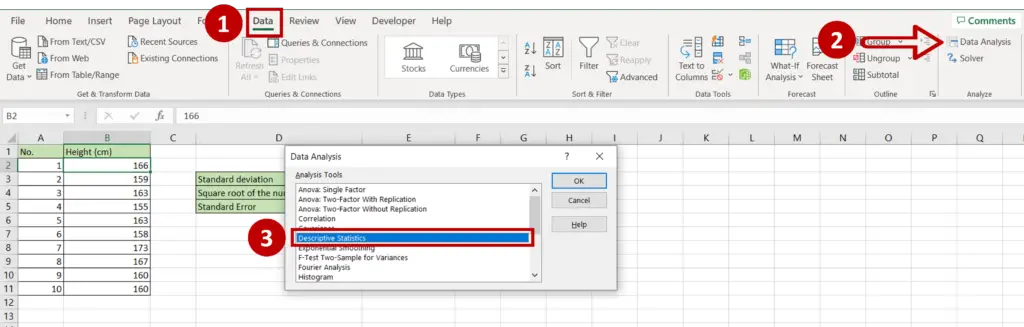
- Go to Data > Analyze
- Click on the Data Analysis button
- In the window, select Descriptive Statistics
- Click OK
Step 5 – Set the parameters
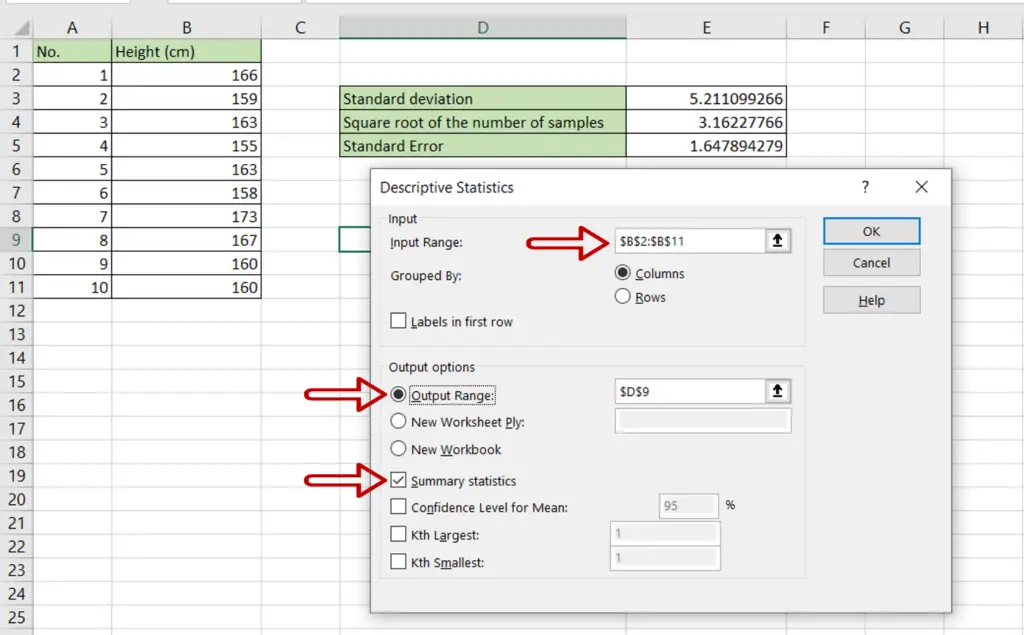
- Define the input range:
- Input Range = the range of the ‘Height (cm)’ column
- Define the output range i.e where you want the result to be displayed
- Tick Summary Statistics
- Click OK
Step 6 – Check the result
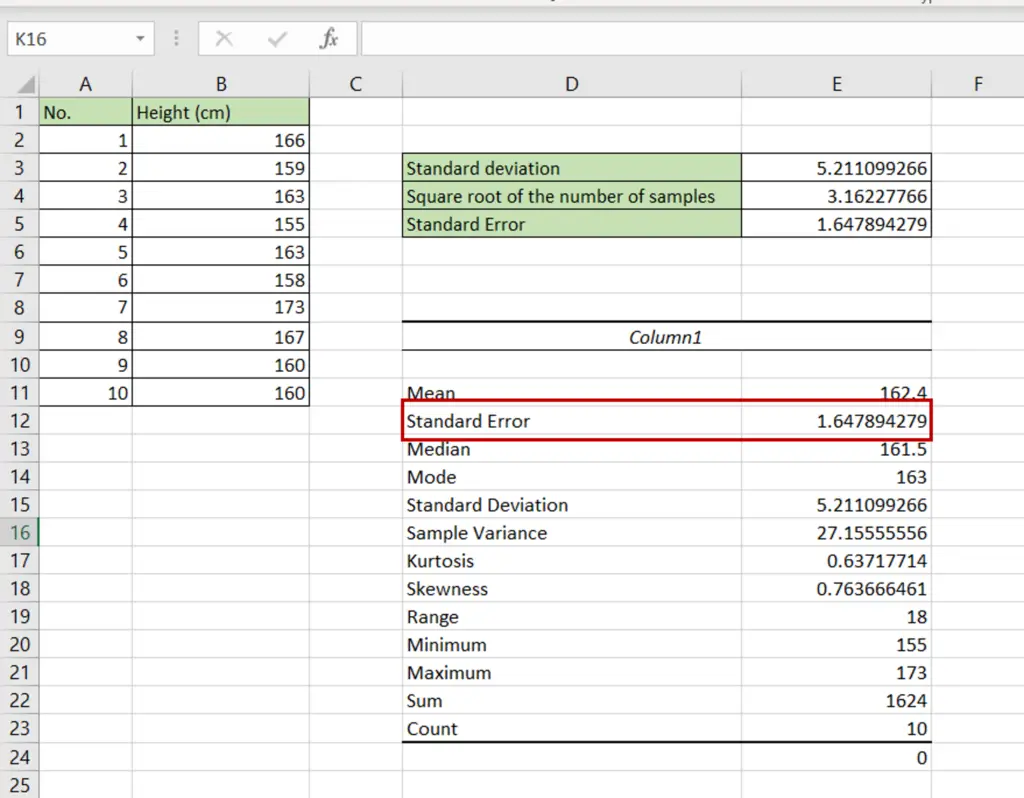
- The Standard Error is displayed along with the other descriptive statistics


