
How to calculate range in Excel
 By
SpreadCheaters
By
SpreadCheaters
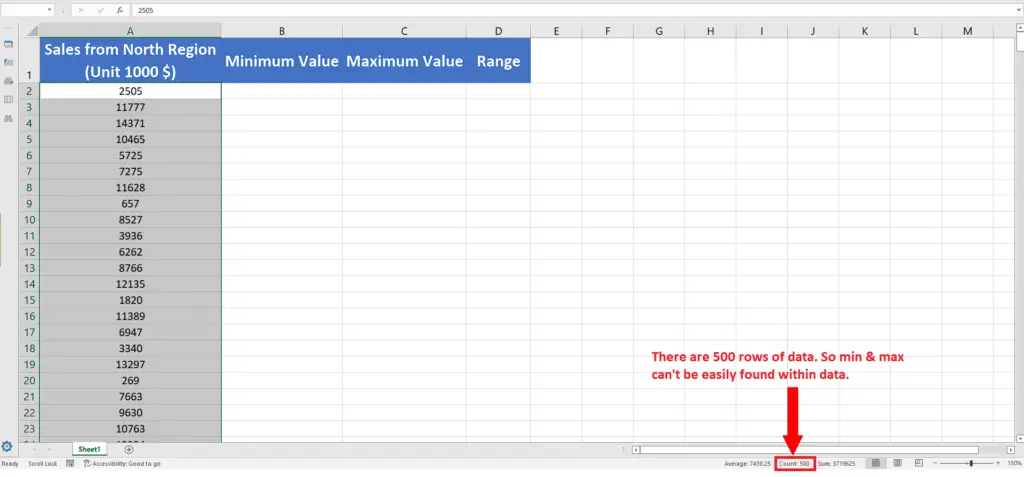
The range of the data means the difference of minimum and maximum values of that particular data. Although it is a very easy calculation and can be performed very easily just by knowing the maximum and minimum values from the dataset. However, when working with very large datasets it is almost impossible to look at the data and find the minimum and maximum values manually. That’s where the power of Excel comes in and makes your life easy. Let’s see how we can do this by following these simple steps. The dataset is shown above.
Excel is a very useful and powerful tool for handling numeric data. It provides a very wide range of mathematical and statistical functions for the users to play with. In today’s tutorial we’ll learn how to calculate the range of data in Excel.
Step 1 – Find out the Minimum Value of sales data
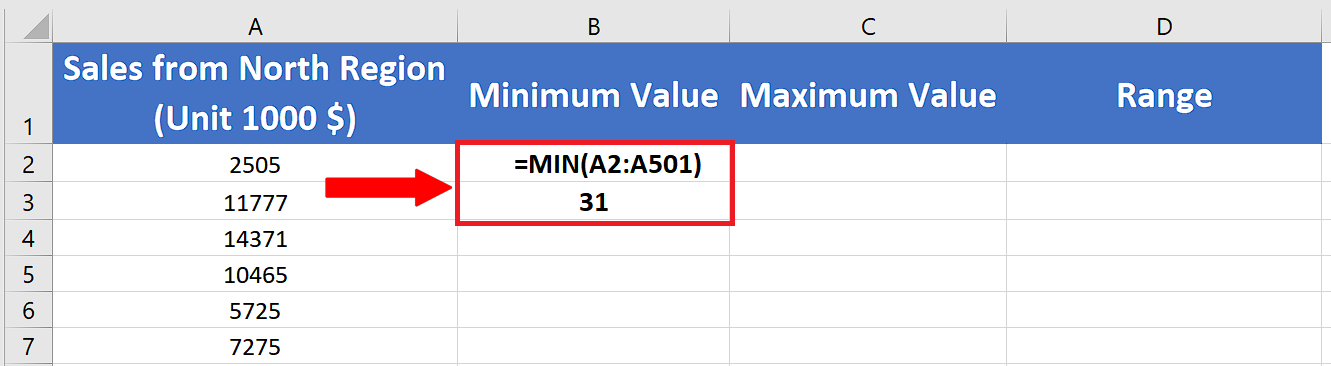
– First of all we’ll find out the minimum value of the data set by using a very simple formula in cell B2, which is
=Min(A2:A501)
Step 2 – Find out the Maximum Value of sales data
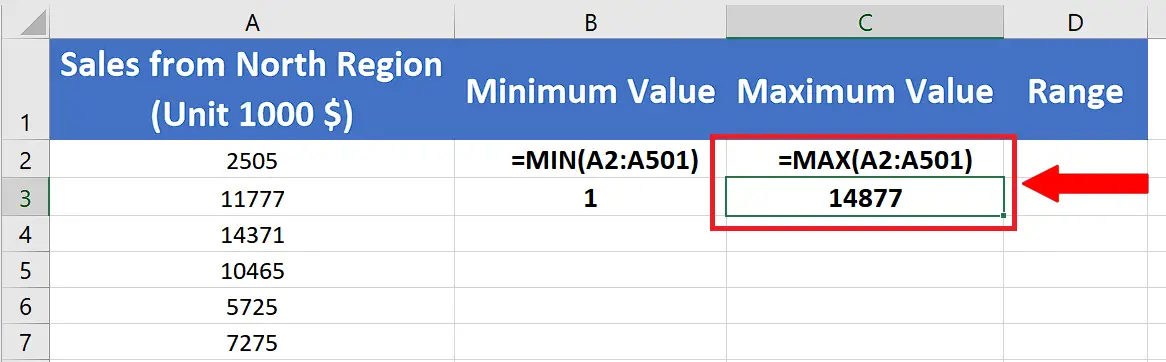
– Now we’ll find out the maximum value of the data set by using a very simple formula in cell B2, which is
=Max(A2:A501)
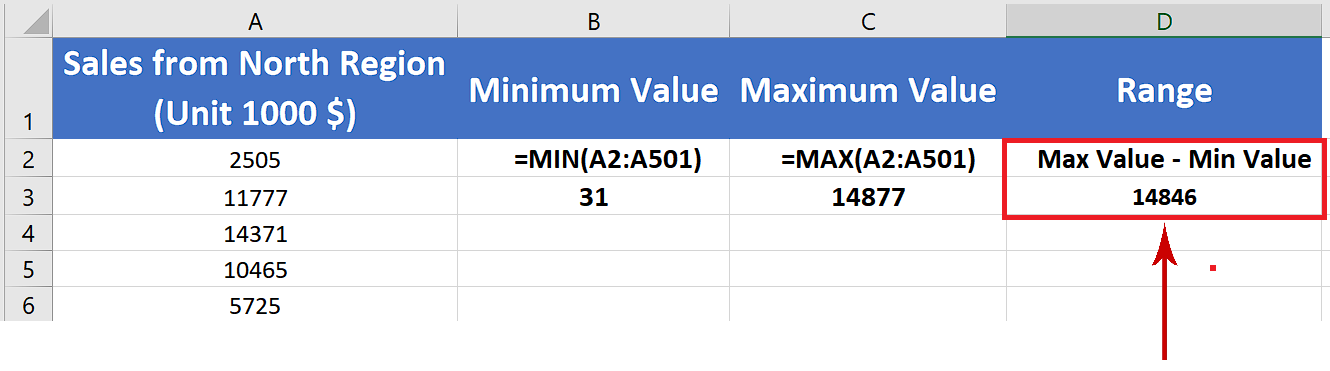
Step 3 – Calculate the range of sales data

– Now we’ve got all the necessary data to find out the range. So we can calculate the range of our data simply by subtracting the maximum value from minimum value.
– The formula would be very simple i.e. =C3-B3


