
How to calculate r2 in Excel
 By
SpreadCheaters
By
SpreadCheaters
You can watch a video tutorial here.
R-squared is used in statistical analysis to understand how well a linear regression model fits a dataset. You can use the R-squared metric to compare various regression models and determine which is the best one to use for the given data. In Excel, you can use the RSQ() function to compute the R-squared value for a dataset. The syntax for RSQ() is:
RSQ(known_y’s, known x’s)
>known_y’s: the range of the response variable
>known_x’s: the range of the predictor variable
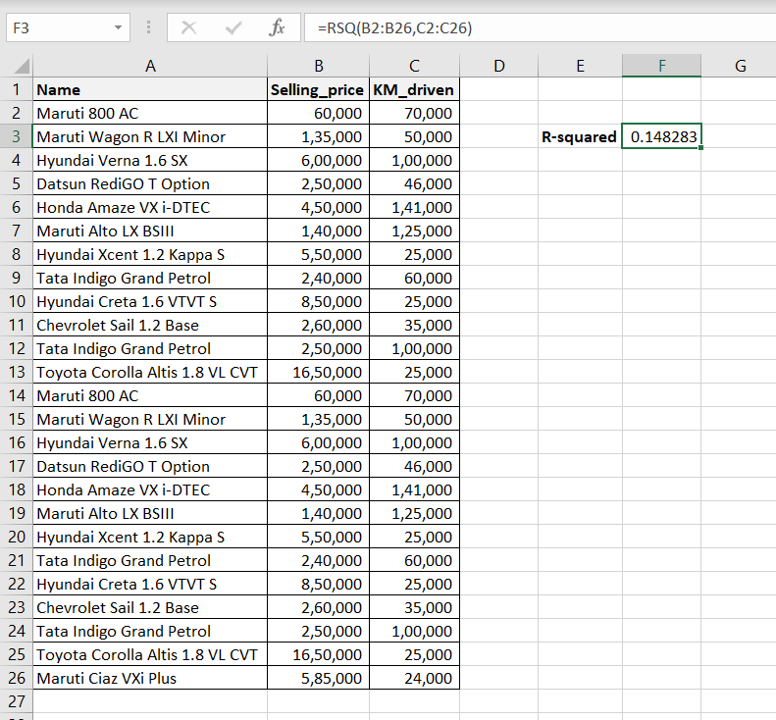
Step 1 – Use the RSQ() function
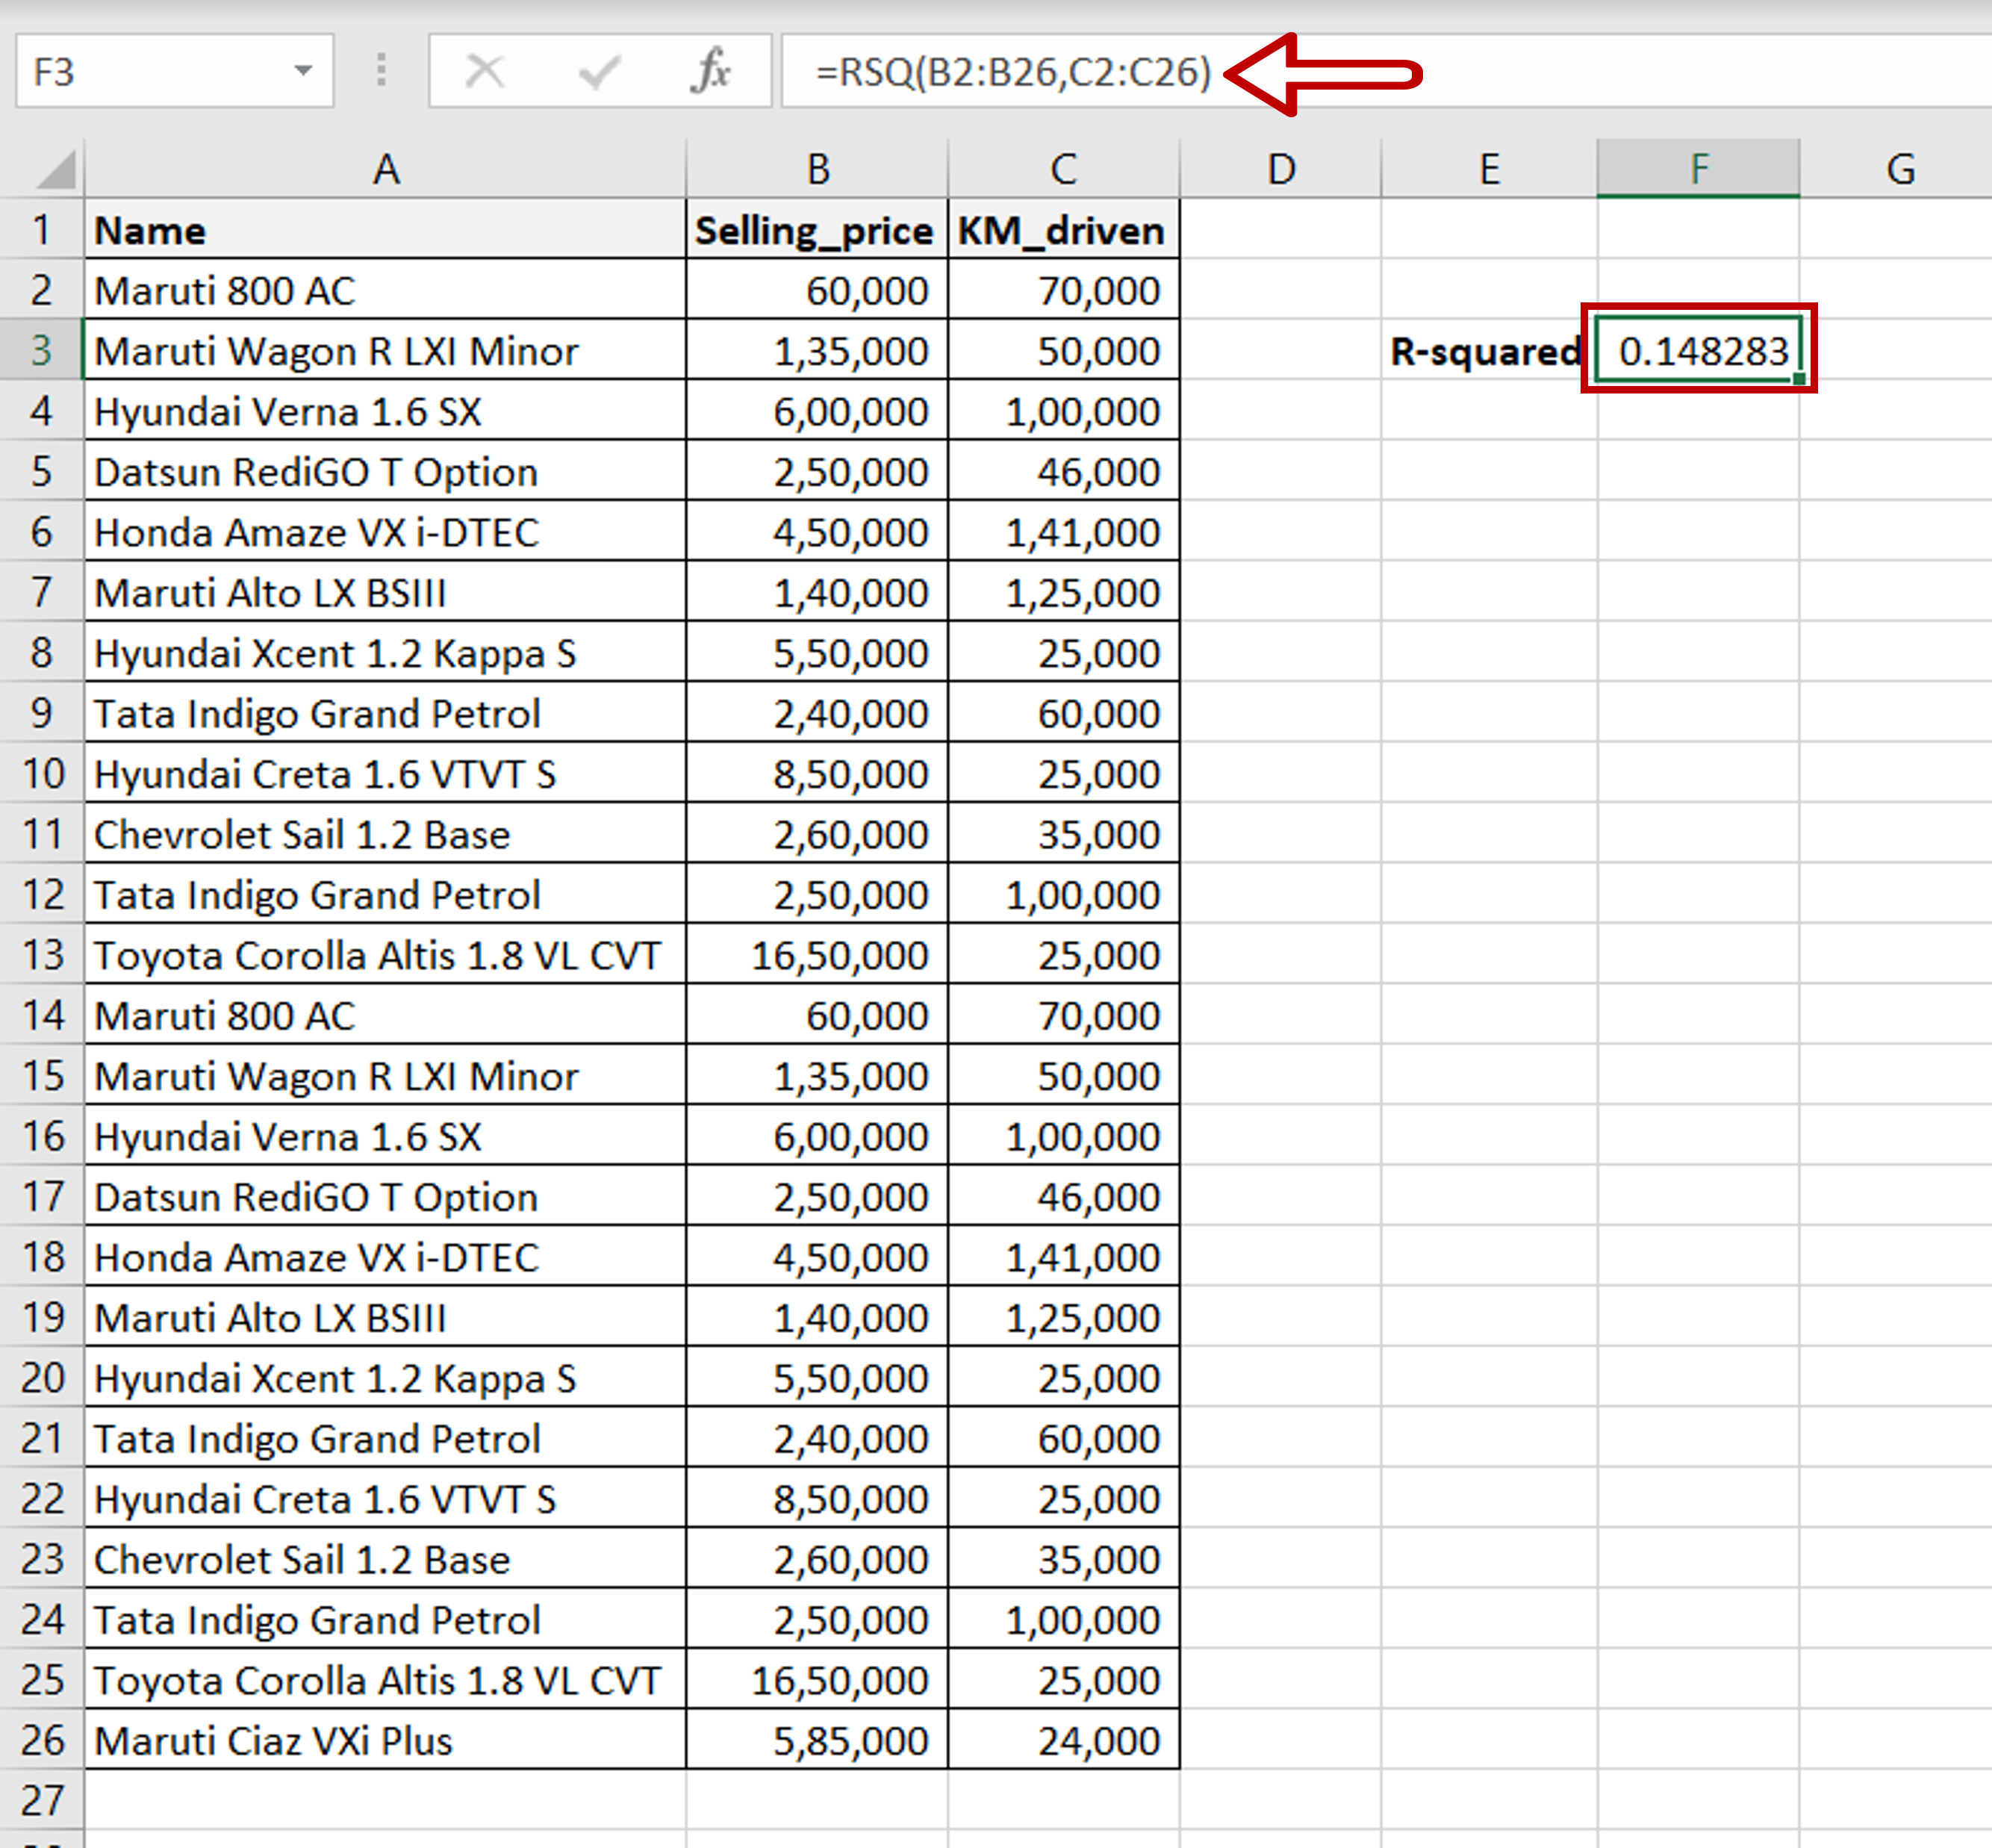
– In this example, we will use ‘KM_driven‘ to predict the ’Selling_price’ so ’Selling_price’ is the response variable and ‘KM_driven’ is the predictor variable
– Type the formula using cell references:
=RSQ(Range of ‘Selling_price’, Range of ‘KM_driven’)
– Press Enter
Note: Here are some things to be aware of when using RSQ():
>Only numbers can be used
>There has to be a range of values for each set of variables i.e. single numbers cannot be used
>There should not be any zeroes in the data being used
>Both ranges should be of equal length


